
Why is Intel stock down today? Key $86.80 support under pressure after foundry concerns

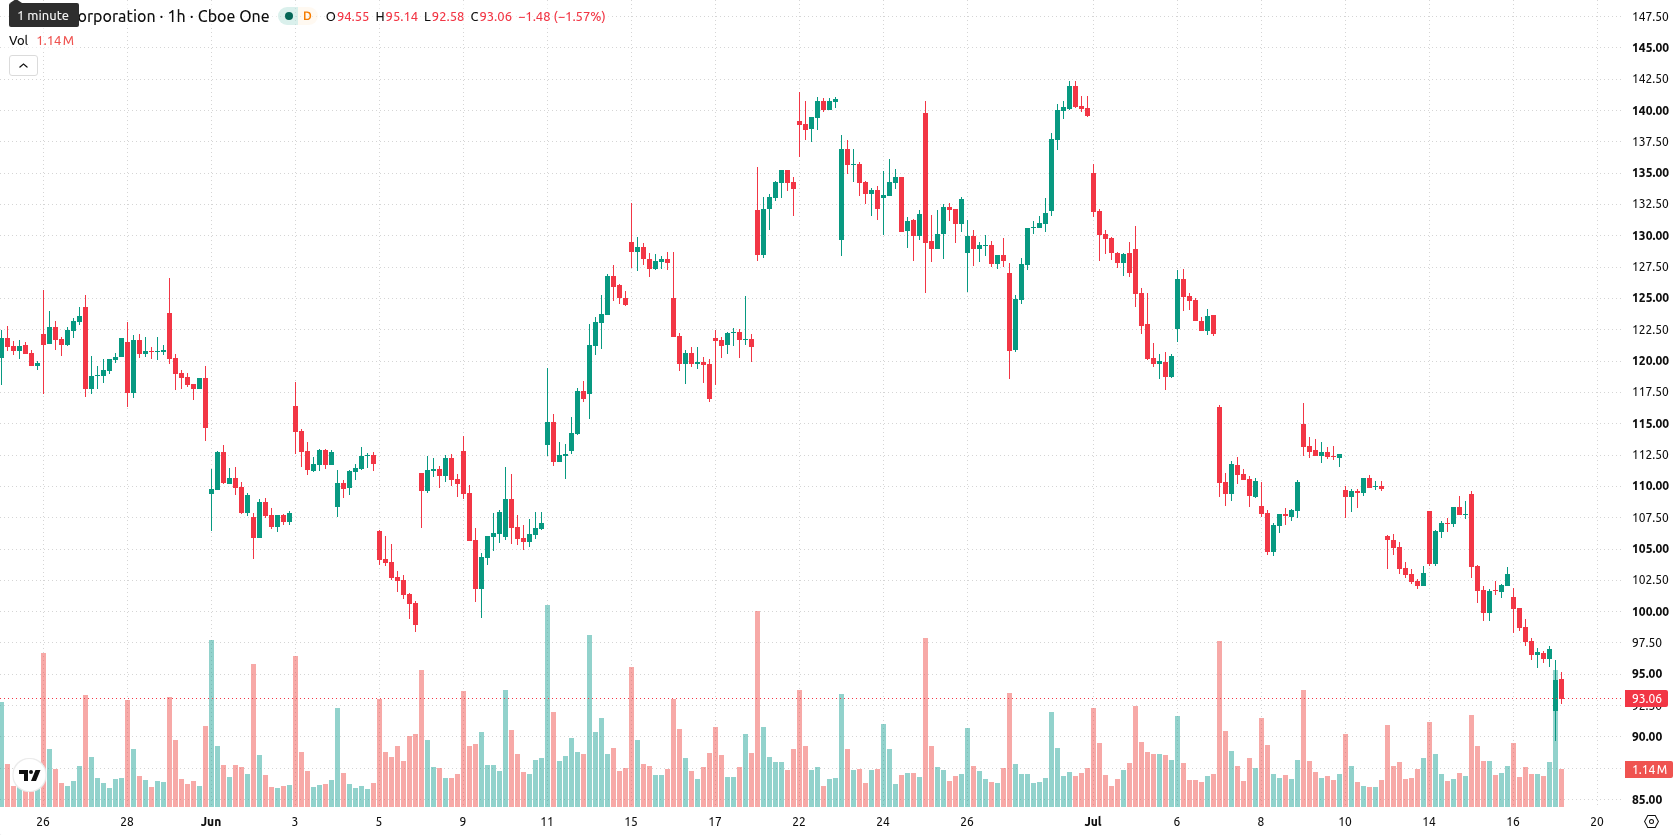
Intel (INTC) stock is trading at $93.11, down 3.81% for the day. Shares are positioned below their short- and medium-term averages, while still holding above long-term support levels.
 98.02
109.61
98.02
109.61
Highlights
- Intel's full deployment of Gemini Enterprise AI via Google Cloud aims to accelerate AI-driven chip design and operational efficiencies.
- Investor sentiment remains cautious amid concerns over execution risk and substantial capital expenditures tied to Intel's foundry business.
- Intel trades with strong short-term bearish momentum, projecting an $86.8 to $99.42 range and downside risk as the dominant scenario.
Innovation gains weighed by foundry execution risks and earnings caution
Intel has expanded its partnership with Google Cloud to fully deploy the Gemini Enterprise AI model across its internal systems, a move aimed at enhancing AI-driven chip design, product management, and business operations, according to Benzinga. This integration of advanced AI is expected to drive improvements in efficiency and innovation, yet investor focus has shifted to execution risks and high capital expenditure tied to Intel's foundry business, which has added uncertainty and contributed to negative sentiment. At the same time, anticipation around Intel's upcoming second-quarter earnings report on July 23 has kept investors cautious, as results may affect future guidance and valuations.
Bearish momentum intensifies amid mixed oversold signals and volatility
On the H1 chart, Intel trades below both its 20-period moving average at $101.57 and its 50-period moving average at $105.54, with price remaining well above the 200-period moving average at $63.85 on the daily timeframe. The Ichimoku Kijun resistance stands at $102.49. Momentum signals are negative, with the Moving Average Convergence Divergence (MACD) and the Average Directional Index (ADX) in Sell mode, while the Commodity Channel Index (CCI) also signals Sell. The Relative Strength Index (RSI) is low at 31.07, suggesting oversold conditions, and Bull/Bear Power points toward seller dominance. However, the Stochastic RSI is neutral, highlighting mixed oscillator signals. The Awesome Oscillator aligns with ongoing downside momentum, while price action remains constrained by an intraday gap and elevated volatility.
Downside risk persists as price approaches volatility-driven range
In the short term, the likely trading range for INTC is projected at $86.8 to $99.42, reflecting a volatility band relative to current levels. Downside moves remain more probable, with the baseline scenario favoring continued range-bound action between support and resistance. A convincing break above the $102.49 resistance would shift the scenario bullish, while a sustained move below $86.8 would confirm further downside potential.
Earlier, analysts noted that Intel faced continued downward momentum despite operational progress, highlighting persistent market pessimism. The current outlook reinforces this caution, with downside moves remaining more probable as investors weigh execution risks and await the July 23 earnings report; a decisive move below $86.8 would confirm further bearish potential.






-
 Afghanistan
-
 Albania
-
 Algeria
-
 Angola
-
 Argentina
-
 Armenia
-
 Australia
-
 Austria
-
 Azerbaijan
-
 Bahamas
-
 Bahrain
-
 Bangladesh
-
 Belarus
-
 Belgium
-
 Bolivia
-
 Botswana
-
 Brazil
-
 Brunei
-
 Bulgaria
-
 Cambodia
-
 Cameroon
-
 Canada
-
 Chile
Chile
-
 China
China
-
 Colombia
-
 Congo
Congo
-
 Costa Rica
-
 Cote d'Ivoire
-
 Croatia
-
 Cuba
Cuba
-
 Cyprus
-
 Czechia
-
 DR Congo
-
 Denmark
-
 Dominican Republic
-
 Ecuador
-
 Egypt
Egypt
-
 El Salvador
-
 Estonia
-
 Eswatini
-
 Ethiopia
-
 Finland
-
 France
-
 Georgia
-
 Germany
-
 Ghana
Ghana
-
 Greece
-
 Haiti
Haiti
-
 Hong Kong
-
 Hungary
-
 India
India
-
 Indonesia
-
 Iran, Islamic republic
-
 Iraq
Iraq
-
 Ireland
-
 Israel
-
 Italy
Italy
-
 Jamaica
-
 Japan
Japan
-
 Jordan
-
 Kazakhstan
-
 Kenya
Kenya
-
 Korea
Korea
-
 Kuwait
-
 Kyrgyzstan
-
 Laos
Laos
-
 Latvia
-
 Lebanon
-
 Lesotho
-
 Libya
Libya
-
 Lithuania
-
 Luxembourg
-
 Madagascar
-
 Malaysia
-
 Malta
Malta
-
 Mauritius
-
 Mexico
-
 Moldova
-
 Mongolia
-
 Montenegro
-
 Morocco
-
 Mozambique
-
 Myanmar
-
 Namibia
-
 Nepal
Nepal
-
 Netherlands
-
 New Zealand
-
 Nigeria
-
 North Macedonia
-
 Norway
-
 Oman
Oman
-
 Pakistan
-
 Palestine
-
 Panama
-
 Papua New Guinea
-
 Paraguay
-
 Peru
Peru
-
 Philippines
-
 Poland
-
 Portugal
-
 Puerto Rico
-
 Qatar
Qatar
-
 Reunion
-
 Romania
-
 Rwanda
-
 Saudi Arabia
-
 Serbia
-
 Singapore
-
 Slovakia
-
 Slovenia
-
 Somalia
-
 South Africa
-
 Spain
Spain
-
 Sri Lanka
-
 Sweden
-
 Switzerland
-
 Syria
Syria
-
 Taiwan
-
 Tajikistan
-
 Tanzania
-
 Thailand
-
 Trinidad and Tobago
-
 Tunisia
-
 Turkey
-
 UAE
UAE
-
 Uganda
-
 Ukraine
-
 United Kingdom
-
United States
-
 Uruguay
-
 Uzbekistan
-
 Venezuela
-
 Vietnam
-
 Yemen
Yemen
-
 Zambia
-
 Zimbabwe
- Forex
- Crypto











