

Intel stock drops as downward price move intensifies amid SoftBank monetization and net loss

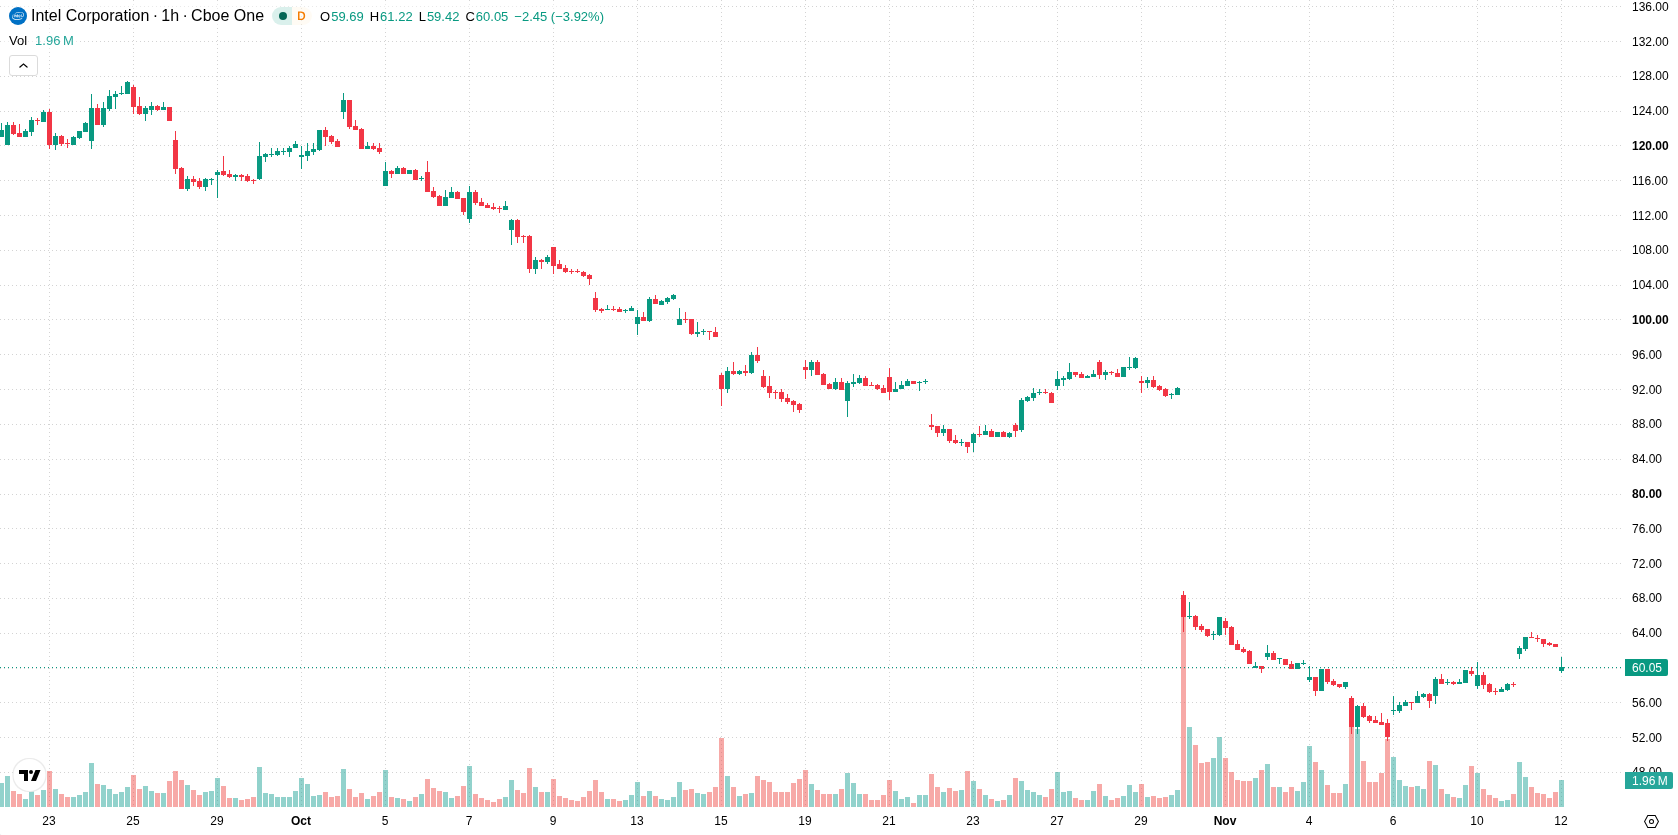
Intel (INTC) stock is trading at $59.95, down 4.08% on the day. The price currently sits below its key short-term average but holds above the medium-term average, while remaining well beneath the long-term trend levels.
 61.33
64.04
Highlights
- SoftBank secured $7.4 billion in liquidity through prepaid forward contracts using its Intel holdings.
- Intel recorded annual revenue of $52.85 billion with a net loss of $267 million and addressed over 200 product vulnerabilities.
- Intel stock remains under short-term selling pressure with a projected range of $55.79 to $64.11 and a 63% chance of further downside.
SoftBank’s liquidity move and ETF inflows contrast with persistent selling
SoftBank raised $7.4 billion through prepaid forward contracts backed by its Intel holdings, a move that increases liquidity for a major shareholder and may affect market supply dynamics, according to Gurufocus. Intel reported annual revenue of $52.85 billion with a net loss of $267 million, reflecting strong sales but ongoing profitability challenges. The company, together with AMD, also issued over 50 new security advisories addressing more than 200 vulnerabilities across their product lines, according to Scworld. ETF flows highlighted $360.9 million in net Intel stock purchases by institutional funds, as reported by Yahoo Finance, though price action has remained under broader selling pressure.
Mixed momentum signals as price hovers between support and average
On the technical front, INTC is positioned below its MA-20 at $60.29 but above the MA-50 at $58.35 on the H1 chart, while remaining well under the long-term MA-200 at $87.26. Immediate support sits at the Ichimoku Kijun level of $59.91. The MACD delivers a Buy signal, whereas the ADX shows a Sell signal, and the RSI, Stoch RSI, and CCI all register neutral readings, marking an absence of extreme momentum conditions on the H1 timeframe. Intraday, Bull/Bear Power is marginally negative at -0.06, indicating a slight edge for sellers, with the Awesome Oscillator holding neutral. The price opened with a gap down of 0.83 and remains near the session low, underscoring heightened volatility and confirming near-term downside pressure in alignment with certain momentum metrics.
Downside favored as wide trading range signals consolidation risk
Over the next two to three trading days, INTC is expected to trade within a wide volatility band between $55.79 and $64.11. The probability of an upside move stands at 37%, while further downside is more likely at 63%. The most likely scenario is for INTC to consolidate within this range. A bullish breakout would require a close above resistance levels, while continued declines are possible if support is breached.
Earlier, analysts noted that Intel’s recovery prospects were contingent on the stock navigating ongoing sector volatility and competitive pressures in the semiconductor space. The current data adds a new dimension, highlighting how increased liquidity maneuvers by major holders and intensifying operational risks now coincide with heightened volatility, making the $55.79–$64.11 range especially pivotal for traders monitoring potential breakouts or breakdowns in the near term.










-
 Afghanistan
-
 Albania
-
 Algeria
-
 Angola
-
 Argentina
-
 Armenia
-
 Australia
-
 Austria
-
 Azerbaijan
-
 Bahamas
-
 Bahrain
-
 Bangladesh
-
 Belarus
-
 Belgium
-
 Bolivia
-
 Botswana
-
 Brazil
-
 Brunei
-
 Bulgaria
-
 Cambodia
-
 Cameroon
-
 Canada
-
 Chile
-
 China
-
 Colombia
-
 Congo
-
 Costa Rica
-
 Cote d'Ivoire
-
 Croatia
-
 Cuba
-
 Cyprus
-
 Czechia
-
 DR Congo
-
 Denmark
-
 Dominican Republic
-
 Ecuador
-
 Egypt
-
 El Salvador
-
 Estonia
-
 Eswatini
-
 Ethiopia
-
 Finland
-
 France
-
 Georgia
-
 Germany
-
 Ghana
-
 Greece
-
 Haiti
-
 Hong Kong
-
 Hungary
-
 India
-
 Indonesia
-
 Iran, Islamic republic
-
 Iraq
-
 Ireland
-
 Israel
-
 Italy
-
 Jamaica
-
 Japan
-
 Jordan
-
 Kazakhstan
-
 Kenya
-
 Korea
-
 Kuwait
-
 Kyrgyzstan
-
 Laos
-
 Latvia
-
 Lebanon
-
 Lesotho
-
 Libya
-
 Lithuania
-
 Luxembourg
-
 Madagascar
-
 Malaysia
-
 Malta
-
 Mauritius
-
 Mexico
-
 Moldova
-
 Mongolia
-
 Montenegro
-
 Morocco
-
 Mozambique
-
 Myanmar
-
 Namibia
-
 Nepal
-
 Netherlands
-
 New Zealand
-
 Nigeria
-
 North Macedonia
-
 Norway
-
 Oman
-
 Pakistan
-
 Palestine
-
 Panama
-
 Papua New Guinea
-
 Paraguay
-
 Peru
-
 Philippines
-
 Poland
-
 Portugal
-
 Puerto Rico
-
 Qatar
-
 Reunion
-
 Romania
-
 Rwanda
-
 Saudi Arabia
-
 Serbia
-
 Singapore
-
 Slovakia
-
 Slovenia
-
 Somalia
-
 South Africa
-
 Spain
-
 Sri Lanka
-
 Sweden
-
 Switzerland
-
 Syria
-
 Taiwan
-
 Tajikistan
-
 Tanzania
-
 Thailand
-
 Trinidad and Tobago
-
 Tunisia
-
 Turkey
-
 UAE
-
 Uganda
-
 Ukraine
-
 United Kingdom
-
United States
-
 Uruguay
-
 Uzbekistan
-
 Venezuela
-
 Vietnam
-
 Yemen
-
 Zambia
-
 Zimbabwe
- Forex
- Crypto












