
Jupiter: strong technical resistance led to a sharp 7.71% daily price drop

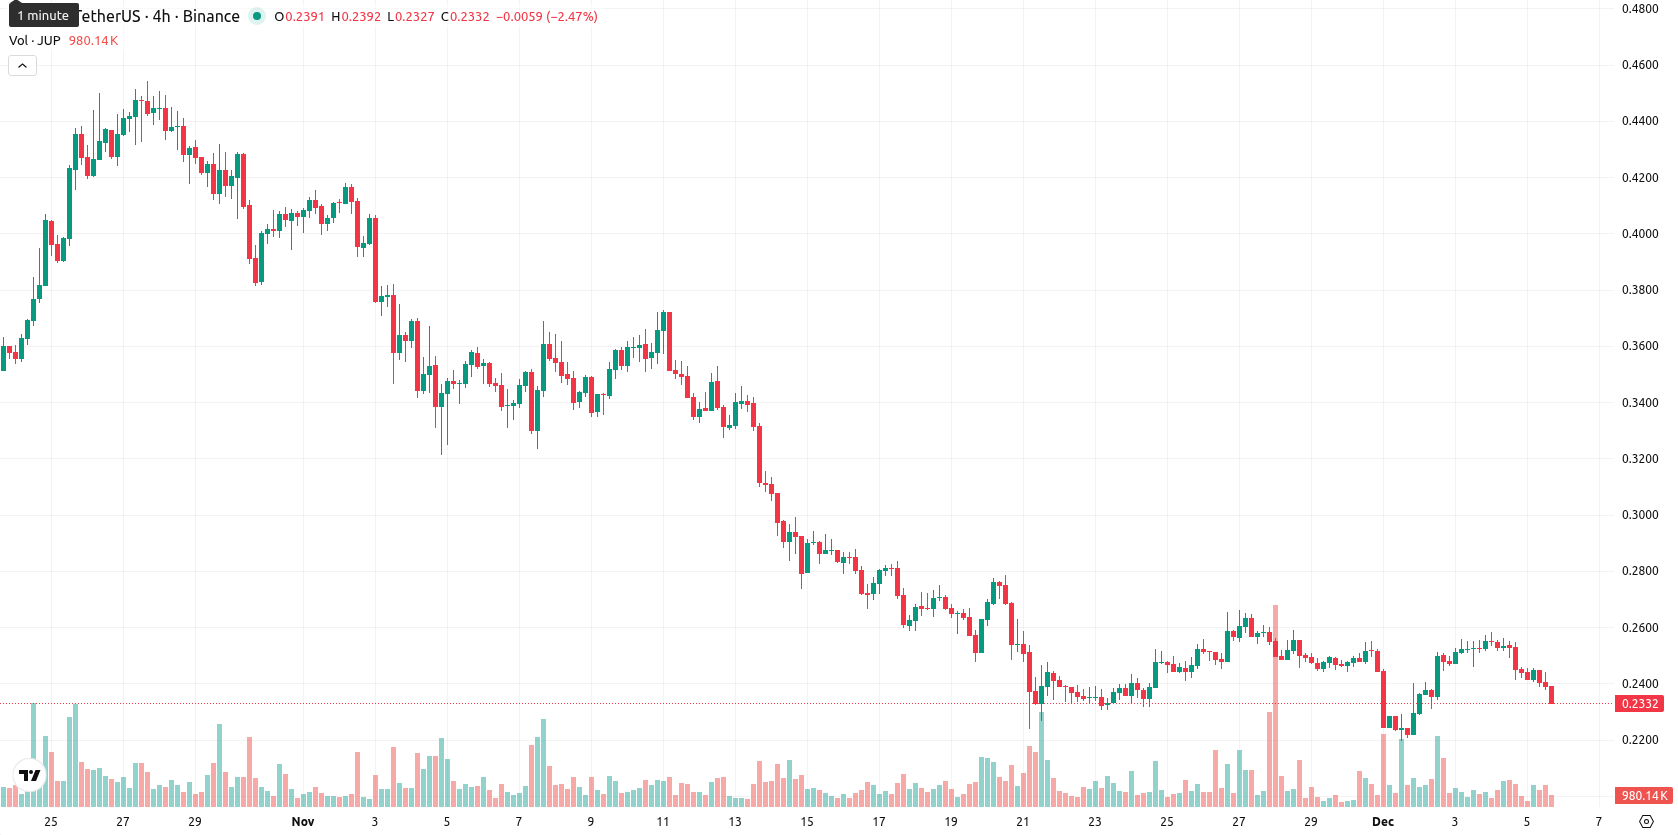
Jupiter (JUP) is trading at $0.2346, well below its MA-20 ($0.2523), MA-50 ($0.3219), and MA-200 ($0.4451). This indicates clear short-, medium-, and long-term pressure from sellers, with resistance seen near the Ichimoku Kijun level of $0.2961 and no immediate dynamic support identified.
 0.2088
0.2193
0.2088
0.2193
Highlights
- JUP is trading at $0.2346, significantly below its MA-20 ($0.2523), MA-50 ($0.3219), and MA-200 ($0.4451), reflecting persistent multi-term bearish momentum.
- Daily indicators including MACD and ADX confirm strong downward momentum, with a sharp 7.71% drop from the previous close and high intraday volatility.
- Probability of further decline exceeds 80%, with a projected 5-day trading range of $0.2100 to $0.2500 and no immediate dynamic support identified.
Conflicting oscillator signals as volatility sustains bearish trend
Momentum indicators signal persistent weakness: both MACD and ADX on D1 confirm strong downward momentum, while RSI (37.7), Stoch RSI (in overbought territory on D1 but oversold or strong sell on lower timeframes), and CCI (neutral but negative) show mixed, conflicted signals around potential exhaustion of the selloff. The Bull/Bear Power remains barely positive but muted, suggesting buyers tried to intervene intraday, yet the daily move is sharply down — off 7.71% from the previous close, with no significant opening gap, and the price currently sits near the lower end of today’s range. Volatility has been high, and the session has seen ongoing pressure following the open, although oscillators diverge between short-term oversold and D1 overbought, highlighting an unstable and negative intraday tone.
High likelihood of new lows as bearish pressure persists
Looking ahead, the expected 5-day trading range for JUP is adjusted to $0.2100 to $0.2500, reflecting recent price action and prevailing volatility. The probability of a further decline is very high (more than 80%), with a price increase much less likely based on uniformly bearish weekly indicators and moving averages. Baseline scenario: price stabilizes sideways within the adjusted band as oversold conditions might slow further losses. Bullish scenario: a rebound above $0.2500 could trigger resistance tests near $0.2961. Bearish scenario: a decisive drop below $0.2100 would point toward renewed lows and continuation of the current downtrend.
Last time, analysts noted JUP was trading just below its short-term average and well under key MA-50 and MA-200 levels, with mixed momentum readings as volatility challenged clear direction. Resistance was identified at the MA-20, MA-50, and Ichimoku Kijun, while most indicators including the MACD, ADX, and Bull/Bear Power remained bearish even as the token posted a strong daily gain amid high intraday volatility and opposing oscillator signals.








-
 Afghanistan
-
 Albania
-
 Algeria
-
 Angola
-
 Argentina
-
 Armenia
-
 Australia
-
 Austria
-
 Azerbaijan
-
 Bahamas
-
 Bahrain
-
 Bangladesh
-
 Belarus
-
 Belgium
-
 Bolivia
-
 Botswana
-
 Brazil
-
 Brunei
-
 Bulgaria
-
 Cambodia
-
 Cameroon
-
 Canada
-
 Chile
Chile
-
 China
China
-
 Colombia
-
 Congo
Congo
-
 Costa Rica
-
 Cote d'Ivoire
-
 Croatia
-
 Cuba
Cuba
-
 Cyprus
-
 Czechia
-
 DR Congo
-
 Denmark
-
 Dominican Republic
-
 Ecuador
-
 Egypt
Egypt
-
 El Salvador
-
 Estonia
-
 Eswatini
-
 Ethiopia
-
 Finland
-
 France
-
 Georgia
-
 Germany
-
 Ghana
Ghana
-
 Greece
-
 Haiti
Haiti
-
 Hong Kong
-
 Hungary
-
 India
India
-
 Indonesia
-
 Iran, Islamic republic
-
 Iraq
Iraq
-
 Ireland
-
 Israel
-
 Italy
Italy
-
 Jamaica
-
 Japan
Japan
-
 Jordan
-
 Kazakhstan
-
 Kenya
Kenya
-
 Korea
Korea
-
 Kuwait
-
 Kyrgyzstan
-
 Laos
Laos
-
 Latvia
-
 Lebanon
-
 Lesotho
-
 Libya
Libya
-
 Lithuania
-
 Luxembourg
-
 Madagascar
-
 Malaysia
-
 Malta
Malta
-
 Mauritius
-
 Mexico
-
 Moldova
-
 Mongolia
-
 Montenegro
-
 Morocco
-
 Mozambique
-
 Myanmar
-
 Namibia
-
 Nepal
Nepal
-
 Netherlands
-
 New Zealand
-
 Nigeria
-
 North Macedonia
-
 Norway
-
 Oman
Oman
-
 Pakistan
-
 Palestine
-
 Panama
-
 Papua New Guinea
-
 Paraguay
-
 Peru
Peru
-
 Philippines
-
 Poland
-
 Portugal
-
 Puerto Rico
-
 Qatar
Qatar
-
 Reunion
-
 Romania
-
 Rwanda
-
 Saudi Arabia
-
 Serbia
-
 Singapore
-
 Slovakia
-
 Slovenia
-
 Somalia
-
 South Africa
-
 Spain
Spain
-
 Sri Lanka
-
 Sweden
-
 Switzerland
-
 Syria
Syria
-
 Taiwan
-
 Tajikistan
-
 Tanzania
-
 Thailand
-
 Trinidad and Tobago
-
 Tunisia
-
 Turkey
-
 UAE
UAE
-
 Uganda
-
 Ukraine
-
 United Kingdom
-
United States
-
 Uruguay
-
 Uzbekistan
-
 Venezuela
-
 Vietnam
-
 Yemen
Yemen
-
 Zambia
-
 Zimbabwe
- Forex
- Crypto











