
Gala price prediction: further downside ahead? GALA falls 7.83% on technical signals

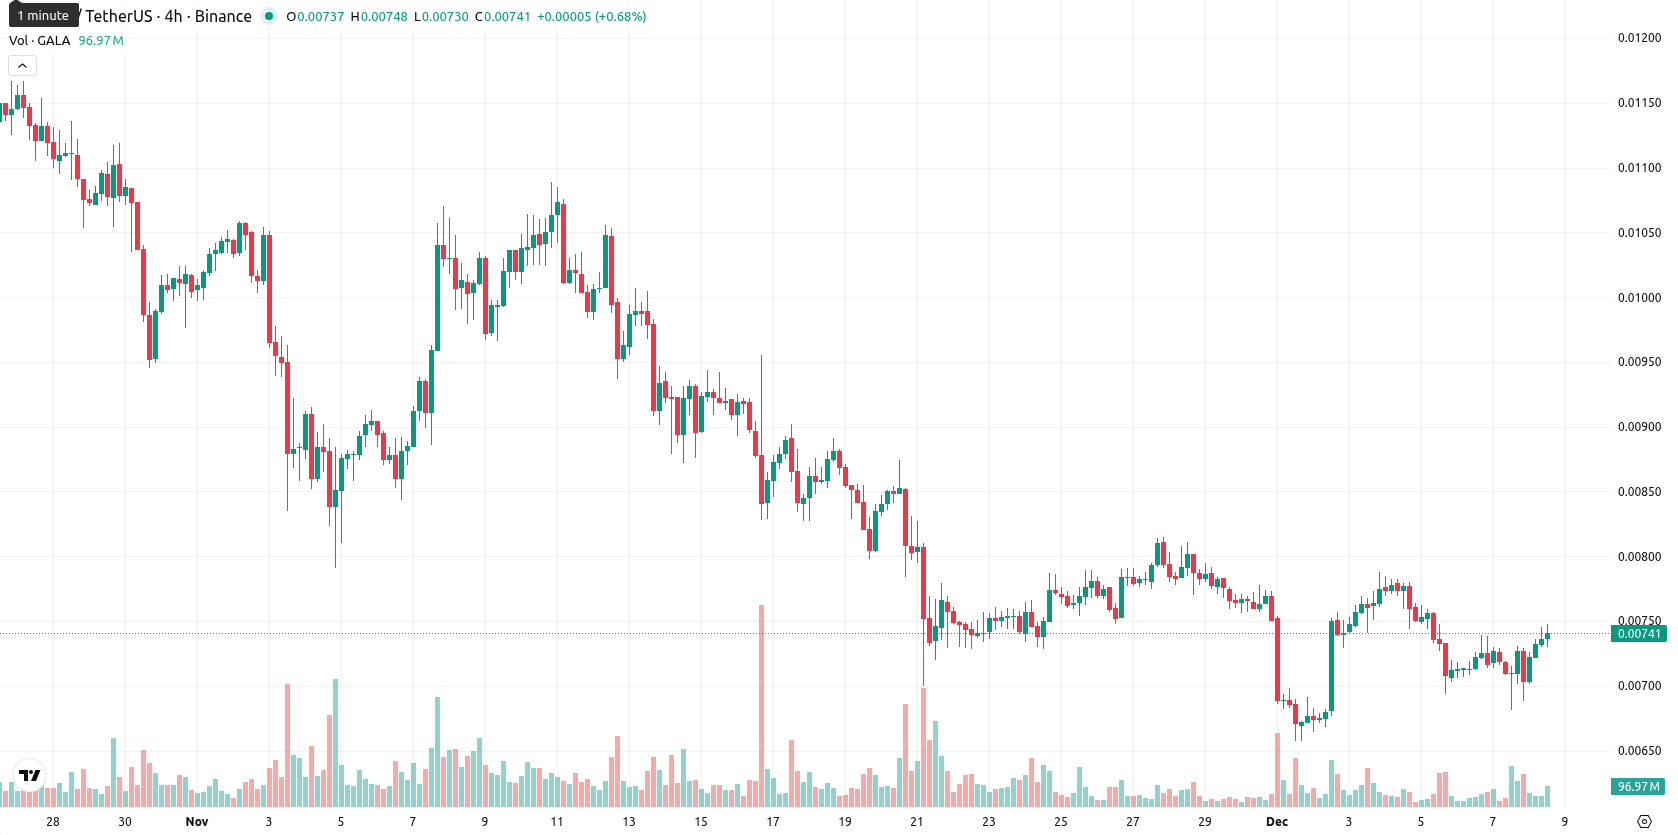
Gala (GALA) is trading at $0.00744, down 7.83% on the day, and remains positioned below its short, medium, and long-term moving averages. This location signals persistent bearish momentum relative to its key technical levels.
 0.002029
0.00222700
0.002029
0.00222700
Highlights
- GALA trades at $0.00744, below its MA-20 ($0.007627), MA-50 ($0.0091048), and MA-200 ($0.01433035), indicating ongoing bearish pressure across all trend horizons.
- Technical signals remain negative as the D1 MACD shows a strong sell, ADX is elevated, and despite a 7.83% daily jump, the price hovers near today's high, reflecting high intraday volatility.
- GALA is projected to remain range-bound between $0.00725 and $0.00775 over the next 5 days, with less than 20% probability of further upward movement.
Bearish technical signals as multiple indicators flag downside risks
Technically, GALA sits below the MA-20 ($0.007627), MA-50 ($0.0091048), and MA-200 ($0.01433035), highlighting a bearish outlook across multiple timeframes. The closest dynamic resistance is the D1 Ichimoku Kijun at $0.008565, with no immediate dynamic support indicated. Momentum signals remain negative with the D1 MACD in strong sell mode and an elevated ADX, while RSI and CCI suggest GALA is approaching oversold territory. Stoch RSI remains neutral, and BBP reflects ongoing seller dominance, even as price volatility stays high and some oscillators show potential short-term exhaustion.
Limited upside as volatility persists and reversal hurdles remain
In the next five sessions, GALA is expected to trade within a volatility band between $0.00725 and $0.00775. The risk of sustained upside is low, with less than a 20% probability for further gains. Downward or sideways movement is more likely as bearish momentum persists, with a bullish reversal requiring a close above $0.00857 and a bearish scenario triggered by a break below $0.00725.
Previously it was reported that GALA was facing sustained bearish momentum as it traded below key moving averages, with the MACD and ADX confirming strong selling pressure while the RSI and CCI did not show oversold extremes. Short-term resistance remained near the Ichimoku Kijun with a narrow trading range anticipated unless buyers could overcome persistent downside pressure.









-
 Afghanistan
-
 Albania
-
 Algeria
-
 Angola
-
 Argentina
-
 Armenia
-
 Australia
-
 Austria
-
 Azerbaijan
-
 Bahamas
-
 Bahrain
-
 Bangladesh
-
 Belarus
-
 Belgium
-
 Bolivia
-
 Botswana
-
 Brazil
-
 Brunei
-
 Bulgaria
-
 Cambodia
-
 Cameroon
-
 Canada
-
 Chile
Chile
-
 China
China
-
 Colombia
-
 Congo
Congo
-
 Costa Rica
-
 Cote d'Ivoire
-
 Croatia
-
 Cuba
Cuba
-
 Cyprus
-
 Czechia
-
 DR Congo
-
 Denmark
-
 Dominican Republic
-
 Ecuador
-
 Egypt
Egypt
-
 El Salvador
-
 Estonia
-
 Eswatini
-
 Ethiopia
-
 Finland
-
 France
-
 Georgia
-
 Germany
-
 Ghana
Ghana
-
 Greece
-
 Haiti
Haiti
-
 Hong Kong
-
 Hungary
-
 India
India
-
 Indonesia
-
 Iran, Islamic republic
-
 Iraq
Iraq
-
 Ireland
-
 Israel
-
 Italy
Italy
-
 Jamaica
-
 Japan
Japan
-
 Jordan
-
 Kazakhstan
-
 Kenya
Kenya
-
 Korea
Korea
-
 Kuwait
-
 Kyrgyzstan
-
 Laos
Laos
-
 Latvia
-
 Lebanon
-
 Lesotho
-
 Libya
Libya
-
 Lithuania
-
 Luxembourg
-
 Madagascar
-
 Malaysia
-
 Malta
Malta
-
 Mauritius
-
 Mexico
-
 Moldova
-
 Mongolia
-
 Montenegro
-
 Morocco
-
 Mozambique
-
 Myanmar
-
 Namibia
-
 Nepal
Nepal
-
 Netherlands
-
 New Zealand
-
 Nigeria
-
 North Macedonia
-
 Norway
-
 Oman
Oman
-
 Pakistan
-
 Palestine
-
 Panama
-
 Papua New Guinea
-
 Paraguay
-
 Peru
Peru
-
 Philippines
-
 Poland
-
 Portugal
-
 Puerto Rico
-
 Qatar
Qatar
-
 Reunion
-
 Romania
-
 Rwanda
-
 Saudi Arabia
-
 Serbia
-
 Singapore
-
 Slovakia
-
 Slovenia
-
 Somalia
-
 South Africa
-
 Spain
Spain
-
 Sri Lanka
-
 Sweden
-
 Switzerland
-
 Syria
Syria
-
 Taiwan
-
 Tajikistan
-
 Tanzania
-
 Thailand
-
 Trinidad and Tobago
-
 Tunisia
-
 Turkey
-
 UAE
UAE
-
 Uganda
-
 Ukraine
-
 United Kingdom
-
United States
-
 Uruguay
-
 Uzbekistan
-
 Venezuela
-
 Vietnam
-
 Yemen
Yemen
-
 Zambia
-
 Zimbabwe
- Forex
- Crypto











