
-7.02% for Plasma — traders weigh mixed signals as volatility expands

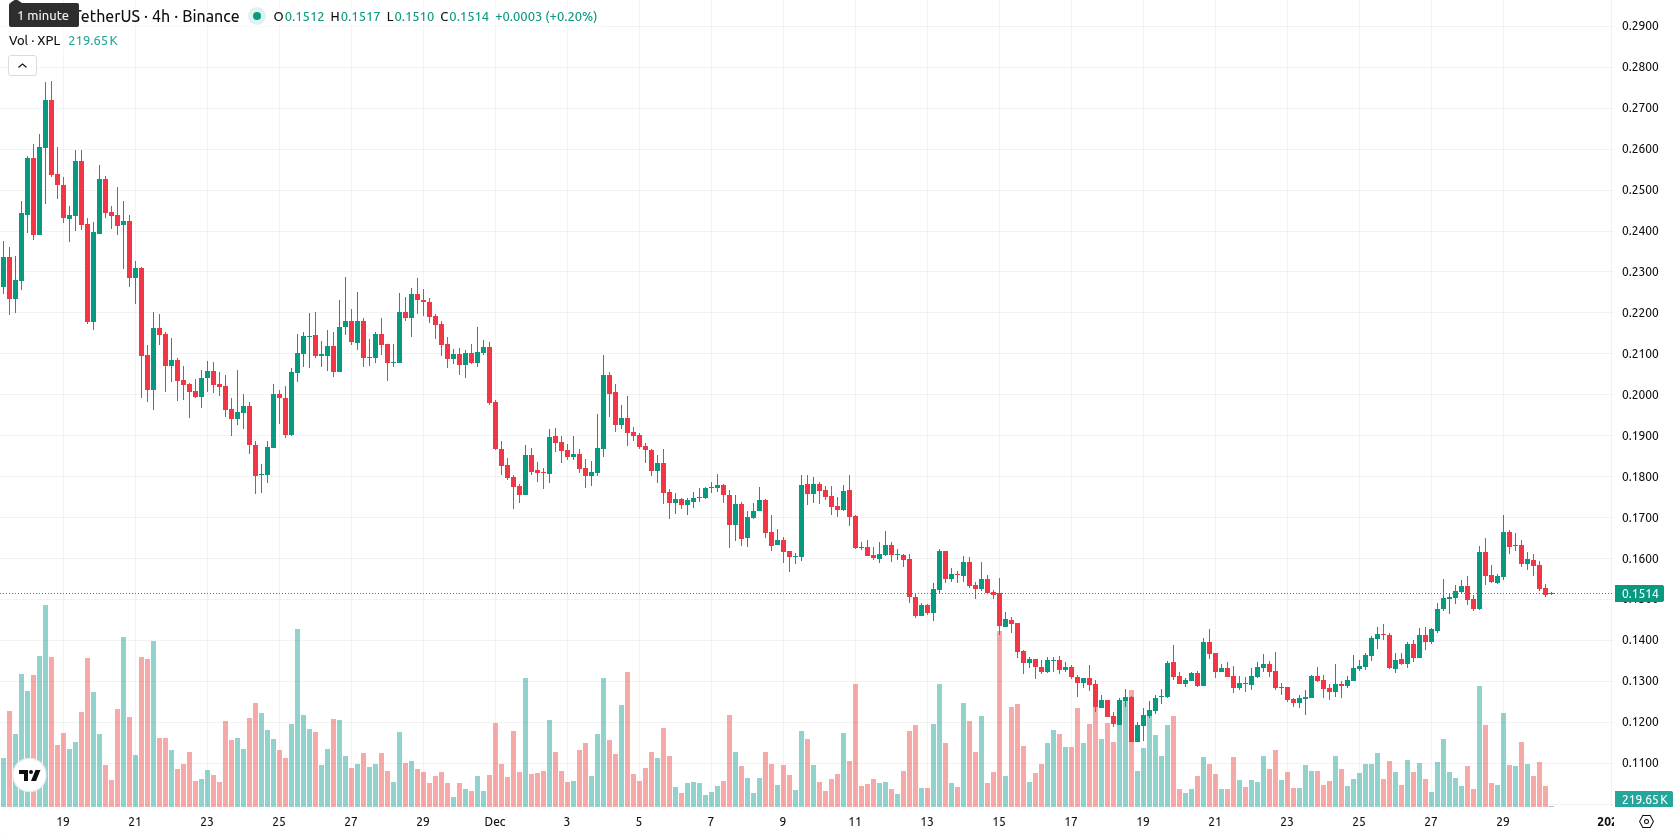
Plasma (XPL) is trading at $0.1511 after a daily drop of 7.02%. The asset holds above the MA-20 at $0.1416, reflecting a short-term bullish tilt, yet it remains under the MA-50 at $0.1851, highlighting ongoing medium-term selling pressure.
 0.0867
0.0962
0.0867
0.0962
Highlights
- XPL closed at $0.1511, falling 7.02% on the day, with price remaining above the MA-20 ($0.1416) but below the MA-50 ($0.1851).
- Momentum indicators are mixed as the D1 MACD signals strong sell, RSI dips below 50, and Stoch RSI is overbought, reflecting heightened volatility and downside risk.
- XPL is expected to trade between $0.1360 and $0.1650 over the next five days, with less than 20% probability of a price rise and bearish bias prevailing.
Mixed momentum as technical resistance and volatility drive divergence
Technical levels show the nearest resistance around the MA-50 at $0.1851, with the Ichimoku Kijun at $0.1624 serving as intermediate resistance. Momentum indicators are mixed: the D1 MACD signals a strong sell and ADX points to active bearish momentum. The RSI is below 50, confirming selling pressure, while Stoch RSI is overbought; CCI stays positive and BBP implies minor buyer strength. This mixed profile signals a divergence between momentum and oscillators, as price action hovered near today's low, indicating volatility and continued downside since the open.
Limited upside as bearish scenario drives range outlook
Over the next five sessions, XPL is likely to move within a volatility band of $0.1360 to $0.1650. The probability of a price rise remains very low, and the default scenario assumes rangebound trading between these levels. A bullish breakout could develop if buyers exceed $0.1624 – $0.1650, while support loss at $0.1500 – $0.1360 would expose further correction risks.
Previously it was reported that Plasma (XPL) was trading above its short-term moving average, confirming near-term bullish momentum, but remained capped below medium-term resistance as signaled by the 50-day moving average. Despite continued intraday buying strength, conflicting momentum signals—strong bearish MACD, neutral-sell RSI, overbought Stoch RSI, and mixed oscillators—suggest heightened volatility and short-term exhaustion near current support and resistance levels.








-
 Afghanistan
-
 Albania
-
 Algeria
-
 Angola
-
 Argentina
-
 Armenia
-
 Australia
-
 Austria
-
 Azerbaijan
-
 Bahamas
-
 Bahrain
-
 Bangladesh
-
 Belarus
-
 Belgium
-
 Bolivia
-
 Botswana
-
 Brazil
-
 Brunei
-
 Bulgaria
-
 Cambodia
-
 Cameroon
-
 Canada
-
 Chile
Chile
-
 China
China
-
 Colombia
-
 Congo
Congo
-
 Costa Rica
-
 Cote d'Ivoire
-
 Croatia
-
 Cuba
Cuba
-
 Cyprus
-
 Czechia
-
 DR Congo
-
 Denmark
-
 Dominican Republic
-
 Ecuador
-
 Egypt
Egypt
-
 El Salvador
-
 Estonia
-
 Eswatini
-
 Ethiopia
-
 Finland
-
 France
-
 Georgia
-
 Germany
-
 Ghana
Ghana
-
 Greece
-
 Haiti
Haiti
-
 Hong Kong
-
 Hungary
-
 India
India
-
 Indonesia
-
 Iran, Islamic republic
-
 Iraq
Iraq
-
 Ireland
-
 Israel
-
 Italy
Italy
-
 Jamaica
-
 Japan
Japan
-
 Jordan
-
 Kazakhstan
-
 Kenya
Kenya
-
 Korea
Korea
-
 Kuwait
-
 Kyrgyzstan
-
 Laos
Laos
-
 Latvia
-
 Lebanon
-
 Lesotho
-
 Libya
Libya
-
 Lithuania
-
 Luxembourg
-
 Madagascar
-
 Malaysia
-
 Malta
Malta
-
 Mauritius
-
 Mexico
-
 Moldova
-
 Mongolia
-
 Montenegro
-
 Morocco
-
 Mozambique
-
 Myanmar
-
 Namibia
-
 Nepal
Nepal
-
 Netherlands
-
 New Zealand
-
 Nigeria
-
 North Macedonia
-
 Norway
-
 Oman
Oman
-
 Pakistan
-
 Palestine
-
 Panama
-
 Papua New Guinea
-
 Paraguay
-
 Peru
Peru
-
 Philippines
-
 Poland
-
 Portugal
-
 Puerto Rico
-
 Qatar
Qatar
-
 Reunion
-
 Romania
-
 Rwanda
-
 Saudi Arabia
-
 Serbia
-
 Singapore
-
 Slovakia
-
 Slovenia
-
 Somalia
-
 South Africa
-
 Spain
Spain
-
 Sri Lanka
-
 Sweden
-
 Switzerland
-
 Syria
Syria
-
 Taiwan
-
 Tajikistan
-
 Tanzania
-
 Thailand
-
 Trinidad and Tobago
-
 Tunisia
-
 Turkey
-
 UAE
UAE
-
 Uganda
-
 Ukraine
-
 United Kingdom
-
United States
-
 Uruguay
-
 Uzbekistan
-
 Venezuela
-
 Vietnam
-
 Yemen
Yemen
-
 Zambia
-
 Zimbabwe
- Forex
- Crypto











