
Plasma price prediction: Can network activity maintain gains? XPL jumps 12.18%

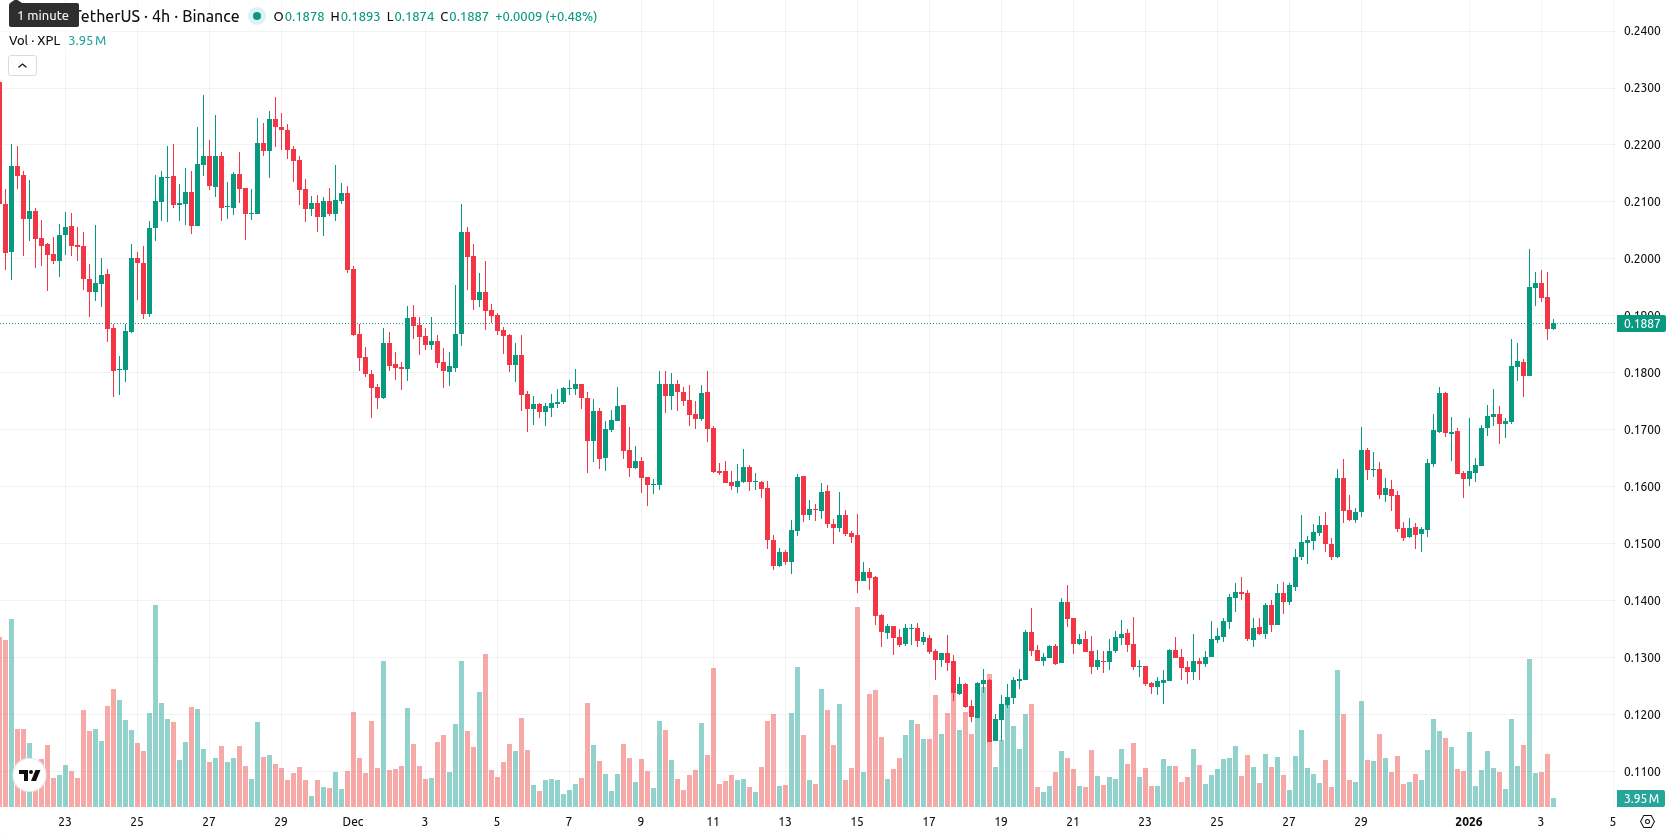
Plasma (XPL) is trading well above both the MA-20 ($0.1443) and MA-50 ($0.1774), indicating a continued bullish structure in the short- to medium-term. The current price action positions XPL comfortably over these key moving averages.
 0.0831
0.0962
0.0831
0.0962
Highlights
- Renewed interest in Plasma's ecosystem and infrastructure has driven increased leveraged trading activity, capturing significant market attention.
- Plasma has experienced a robust rebound, prompting market participants to closely monitor developments related to its network.
- Heightened participation signals growing investor focus on recent progress within the Plasma network ecosystem.
Leveraged trading rises as ecosystem progress sparks renewed interest
Renewed interest in Plasma's ecosystem and infrastructure has contributed to increased leveraged trading activity, drawing significant market attention. The asset's robust rebound has led market participants to closely monitor developments related to its network. Heightened participation reflects the growing focus on recent progress within Plasma.
Momentum signals diverge as intraday volatility and overbought risks emerge
The Ichimoku Kijun level at $0.1584 now acts as dynamic support, while the MA-50 ($0.1774) is the closest medium-term floor, and there is no clear resistance above except for potential round levels. Momentum signals are generally bullish with ADX showing strong trend strength and MACD holding neutral on the daily but confirming upward momentum across intraday timeframes. RSI D1 is at 64.88, suggesting positive momentum but not yet overbought, while CCI and Stoch RSI both indicate overbought conditions and possible short-term fatigue. Bull/Bear Power (BBP) remains positive, confirming buyer dominance intraday. There was a notable gap up from the previous close ($0.1732) to the open ($0.1956), with price now near the middle of today’s range ($0.1917 – $0.1979), reflecting high intraday volatility and some consolidation following initial strength toward session highs. While most momentum indicators point up, overbought oscillators signal potential for near-term pauses, highlighting a divergence that warrants caution ahead.
Longer-term upside capped as bearish bias dominates short-term outlook
For the next five trading days, the expected price range is $0.175 to $0.210, based on adjusted weekly volatility bands around the current level. The probability of further upside is very low (less than 20%), according to the lack of weekly buy signals from higher timeframe indicators, making a downward or sideways move more likely. The baseline scenario sees the price fluctuating between $0.175 and $0.210. A bullish scenario would require a clear break and sustained trade above $0.210, while a bearish outcome could unfold if the price falls below the $0.175 support zone.
Previously it was reported that Plasma (XPL) is trading above its key short-term moving averages, with strong short-term momentum but signs of consolidation as the price compresses near medium-term resistance. While support is seen near $0.148 and resistance at $0.178–$0.180, mixed momentum indicators and overbought oscillators suggest limited upside potential and a probable continuation of sideways trading within established ranges.








-
 Afghanistan
-
 Albania
-
 Algeria
-
 Angola
-
 Argentina
-
 Armenia
-
 Australia
-
 Austria
-
 Azerbaijan
-
 Bahamas
-
 Bahrain
-
 Bangladesh
-
 Belarus
-
 Belgium
-
 Bolivia
-
 Botswana
-
 Brazil
-
 Brunei
-
 Bulgaria
-
 Cambodia
-
 Cameroon
-
 Canada
-
 Chile
Chile
-
 China
China
-
 Colombia
-
 Congo
Congo
-
 Costa Rica
-
 Cote d'Ivoire
-
 Croatia
-
 Cuba
Cuba
-
 Cyprus
-
 Czechia
-
 DR Congo
-
 Denmark
-
 Dominican Republic
-
 Ecuador
-
 Egypt
Egypt
-
 El Salvador
-
 Estonia
-
 Eswatini
-
 Ethiopia
-
 Finland
-
 France
-
 Georgia
-
 Germany
-
 Ghana
Ghana
-
 Greece
-
 Haiti
Haiti
-
 Hong Kong
-
 Hungary
-
 India
India
-
 Indonesia
-
 Iran, Islamic republic
-
 Iraq
Iraq
-
 Ireland
-
 Israel
-
 Italy
Italy
-
 Jamaica
-
 Japan
Japan
-
 Jordan
-
 Kazakhstan
-
 Kenya
Kenya
-
 Korea
Korea
-
 Kuwait
-
 Kyrgyzstan
-
 Laos
Laos
-
 Latvia
-
 Lebanon
-
 Lesotho
-
 Libya
Libya
-
 Lithuania
-
 Luxembourg
-
 Madagascar
-
 Malaysia
-
 Malta
Malta
-
 Mauritius
-
 Mexico
-
 Moldova
-
 Mongolia
-
 Montenegro
-
 Morocco
-
 Mozambique
-
 Myanmar
-
 Namibia
-
 Nepal
Nepal
-
 Netherlands
-
 New Zealand
-
 Nigeria
-
 North Macedonia
-
 Norway
-
 Oman
Oman
-
 Pakistan
-
 Palestine
-
 Panama
-
 Papua New Guinea
-
 Paraguay
-
 Peru
Peru
-
 Philippines
-
 Poland
-
 Portugal
-
 Puerto Rico
-
 Qatar
Qatar
-
 Reunion
-
 Romania
-
 Rwanda
-
 Saudi Arabia
-
 Serbia
-
 Singapore
-
 Slovakia
-
 Slovenia
-
 Somalia
-
 South Africa
-
 Spain
Spain
-
 Sri Lanka
-
 Sweden
-
 Switzerland
-
 Syria
Syria
-
 Taiwan
-
 Tajikistan
-
 Tanzania
-
 Thailand
-
 Trinidad and Tobago
-
 Tunisia
-
 Turkey
-
 UAE
UAE
-
 Uganda
-
 Ukraine
-
 United Kingdom
-
United States
-
 Uruguay
-
 Uzbekistan
-
 Venezuela
-
 Vietnam
-
 Yemen
Yemen
-
 Zambia
-
 Zimbabwe
- Forex
- Crypto











