
Toncoin gains 3.92% as strong buyer momentum meets pullback risk

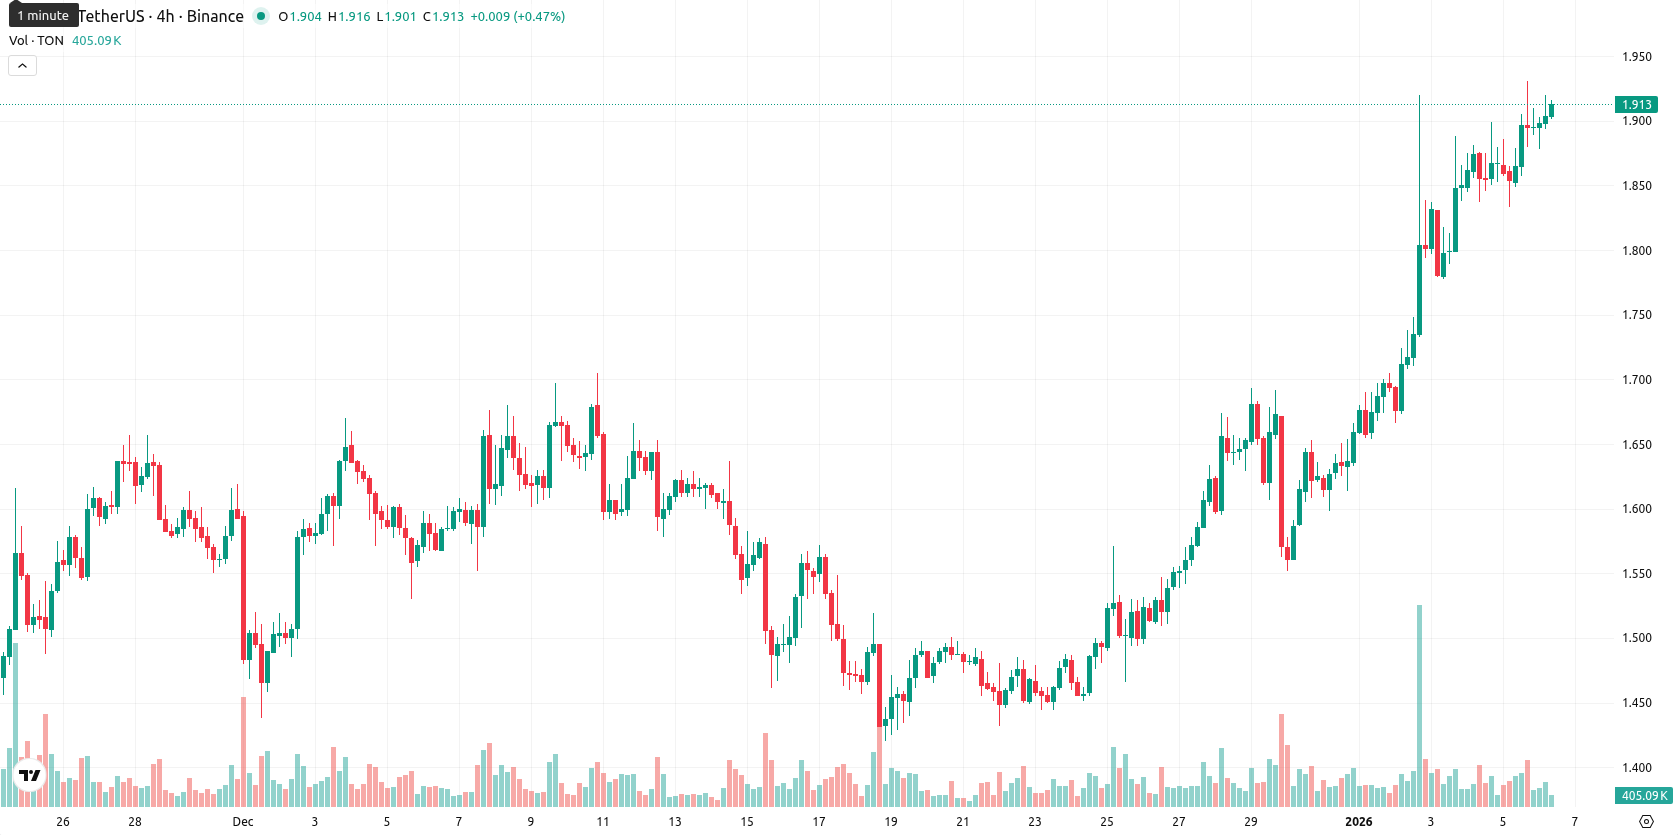
Toncoin (TON) is trading at $1.912, posting a daily gain of $0.072 or 3.92%. The asset holds above its MA-20 ($1.603) and MA-50 ($1.600), yet remains significantly below the long-term MA-200 ($2.534).
Highlights
- TON trades at $1.912, above the MA-20 ($1.603) and MA-50 ($1.600) but significantly below the MA-200 ($2.534), indicating strong short- and medium-term momentum with ongoing long-term resistance.
- Momentum indicators such as MACD, ADX, and the Awesome Oscillator support bullish sentiment, but overbought readings on RSI (71.5), Stoch RSI (100), and CCI (163.2) warn of potential exhaustion and a near-term pullback risk.
- The forecast for the next five trading days is range-bound between $1.88 and $2.02, with a less than 20% probability of a breakout higher and elevated risk of a decline if support at $1.67 fails.
Momentum divergence as overbought signals clash with bullish trend
TON maintains a bullish setup over the short and medium term due to persistent trading above the MA-20 and MA-50, with ongoing long-term pressure below the MA-200. The nearest dynamic support is at the Ichimoku Kijun ($1.674), while resistance stands at the MA-50 and psychological barrier near $2.00. Momentum indicators such as daily MACD and ADX support further buying, but oscillators including RSI (71.5), Stoch RSI (100), and CCI (163.2) signal overbought conditions, highlighting possible exhaustion. Bull/Bear Power continues to reflect buyer strength intraday, and the Awesome Oscillator confirms the trend; nonetheless, the alignment of strong momentum with overbought warnings creates a divergence and elevates short-term pullback risks.
Range-bound bias prevails as bearish momentum limits upside
Over the next five trading days, TON is expected to trade in a $1.88 – $2.02 volatility band relative to current levels. The likelihood of a further rise is low (less than 20%) as signals from weekly MACD, ADX, and RSI suggest bearish pressure dominates, tipping the balance towards a potential decline. Range-bound movement remains the baseline scenario, but a decisive move above $2.02 could open a path to the 200-day average, while a fall below the Kijun support near $1.67 may accelerate bearish momentum.
Last time, analysts noted that Toncoin remains in a short- to medium-term bullish structure above its MA-20 and MA-50, but still faces longer-term resistance below the MA-200. Momentum indicators such as MACD and ADX confirm ongoing buying strength, yet overbought signals from the RSI and Stoch RSI highlight a risk of a short-term pullback, with price expected to consolidate between support near $1.80 and resistance at $1.95.


Latest GRAM News


-
 Afghanistan
-
 Albania
-
 Algeria
-
 Angola
-
 Argentina
-
 Armenia
-
 Australia
-
 Austria
-
 Azerbaijan
-
 Bahamas
-
 Bahrain
-
 Bangladesh
-
 Belarus
-
 Belgium
-
 Bolivia
-
 Botswana
-
 Brazil
-
 Brunei
-
 Bulgaria
-
 Cambodia
-
 Cameroon
-
 Canada
-
 Chile
Chile
-
 China
China
-
 Colombia
-
 Congo
Congo
-
 Costa Rica
-
 Cote d'Ivoire
-
 Croatia
-
 Cuba
Cuba
-
 Cyprus
-
 Czechia
-
 DR Congo
-
 Denmark
-
 Dominican Republic
-
 Ecuador
-
 Egypt
Egypt
-
 El Salvador
-
 Estonia
-
 Eswatini
-
 Ethiopia
-
 Finland
-
 France
-
 Georgia
-
 Germany
-
 Ghana
Ghana
-
 Greece
-
 Haiti
Haiti
-
 Hong Kong
-
 Hungary
-
 India
India
-
 Indonesia
-
 Iran, Islamic republic
-
 Iraq
Iraq
-
 Ireland
-
 Israel
-
 Italy
Italy
-
 Jamaica
-
 Japan
Japan
-
 Jordan
-
 Kazakhstan
-
 Kenya
Kenya
-
 Korea
Korea
-
 Kuwait
-
 Kyrgyzstan
-
 Laos
Laos
-
 Latvia
-
 Lebanon
-
 Lesotho
-
 Libya
Libya
-
 Lithuania
-
 Luxembourg
-
 Madagascar
-
 Malaysia
-
 Malta
Malta
-
 Mauritius
-
 Mexico
-
 Moldova
-
 Mongolia
-
 Montenegro
-
 Morocco
-
 Mozambique
-
 Myanmar
-
 Namibia
-
 Nepal
Nepal
-
 Netherlands
-
 New Zealand
-
 Nigeria
-
 North Macedonia
-
 Norway
-
 Oman
Oman
-
 Pakistan
-
 Palestine
-
 Panama
-
 Papua New Guinea
-
 Paraguay
-
 Peru
Peru
-
 Philippines
-
 Poland
-
 Portugal
-
 Puerto Rico
-
 Qatar
Qatar
-
 Reunion
-
 Romania
-
 Rwanda
-
 Saudi Arabia
-
 Serbia
-
 Singapore
-
 Slovakia
-
 Slovenia
-
 Somalia
-
 South Africa
-
 Spain
Spain
-
 Sri Lanka
-
 Sweden
-
 Switzerland
-
 Syria
Syria
-
 Taiwan
-
 Tajikistan
-
 Tanzania
-
 Thailand
-
 Trinidad and Tobago
-
 Tunisia
-
 Turkey
-
 UAE
UAE
-
 Uganda
-
 Ukraine
-
 United Kingdom
-
United States
-
 Uruguay
-
 Uzbekistan
-
 Venezuela
-
 Vietnam
-
 Yemen
Yemen
-
 Zambia
-
 Zimbabwe
- Forex
- Crypto
