
Chainlink price prediction: sideways action likely as LINK slips and bears hold ground

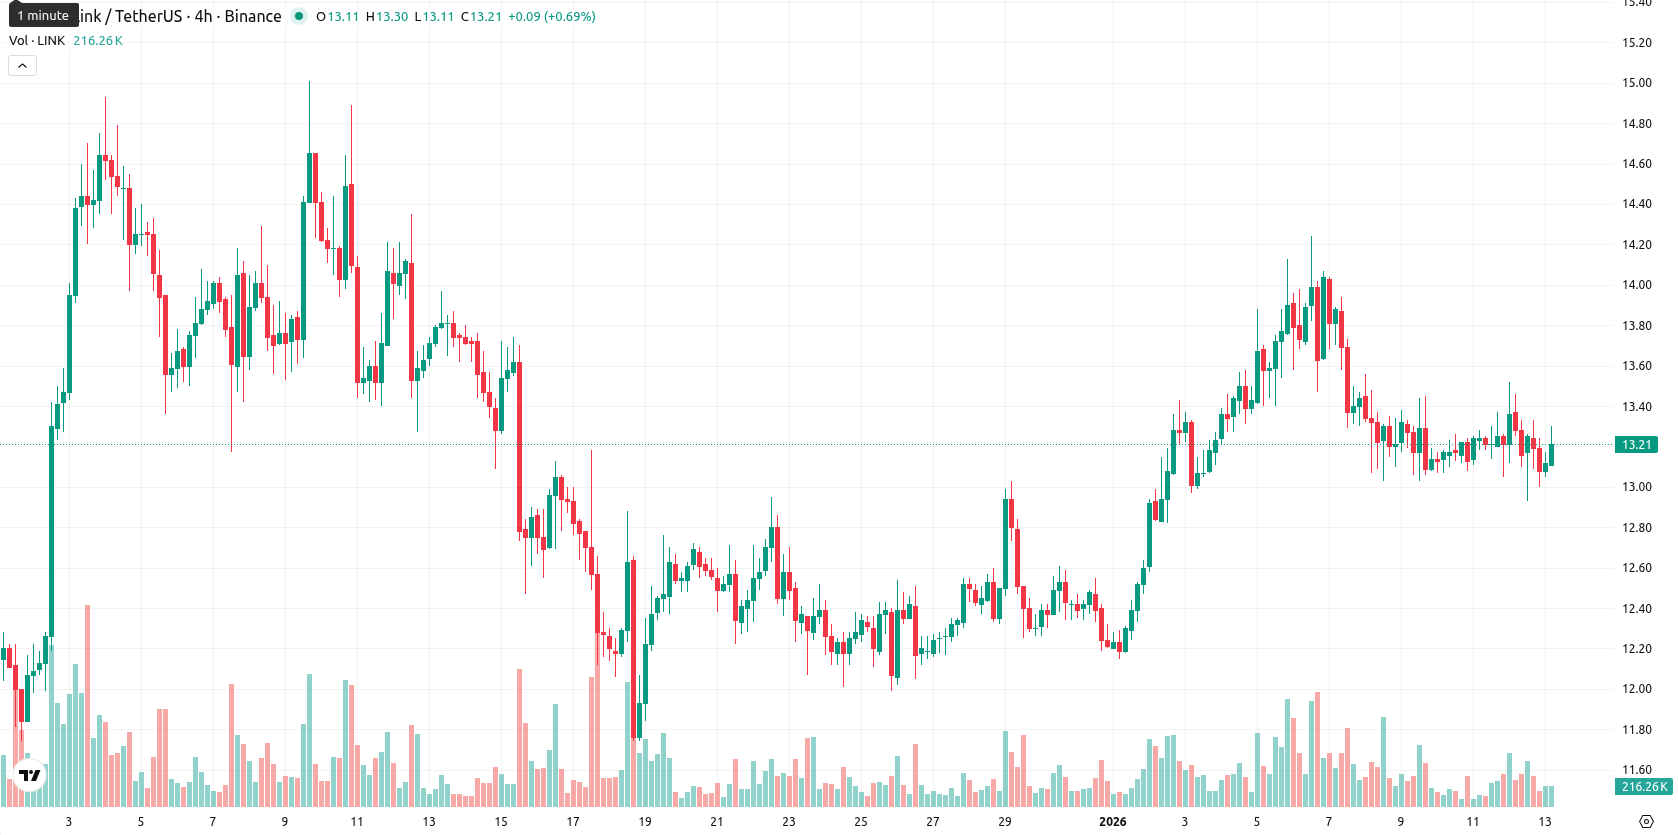
Chainlink (LINK) is trading at $13.21, which is above the MA-20 ($12.91) and slightly above MA-50 ($13.10) but well below the MA-200 ($17.58). This setup reflects short-term upward momentum, medium-term consolidation, and persistent long-term bearish pressure.
 8.63
8.41
8.63
8.41
Highlights
- Chainlink established strategic partnerships to bring S&P Global Ratings, FTSE Russell, Deutsche Börse, Eurex, Tradeweb, and Xetra data on-chain via its DataLink product.
- Major financial institutions including Swift, BNY Mellon, ANZ Bank, Citi, and BNP Paribas have adopted Chainlink for applications such as price oracles, automated compliance, and proof of reserves.
- Bitwise received approval to launch a regulated spot Chainlink ETF (ticker: CLNK) in the United States, increasing institutional access to LINK.
Institutional adoption expands as strategic partnerships drive network integration
Chainlink has expanded its ecosystem through a series of strategic partnerships, connecting institutional and financial data from S&P Global Ratings, FTSE Russell, Deutsche Börse, Eurex, Tradeweb, and Xetra on-chain through its DataLink product. Adoption by financial institutions such as Swift, BNY Mellon, ANZ Bank, Citi, and BNP Paribas highlights the growing integration of Chainlink's network for use cases like price oracles, automated compliance, and proof of reserves. Notably, Bitwise received approval to launch a regulated spot Chainlink ETF (ticker: CLNK) in the United States, broadening institutional access to LINK.
Mixed momentum signals as price tests resistance and support boundaries
The Ichimoku Kijun at $12.99 serves as the nearest dynamic support, while resistance is likely near the MA-50 at $13.10 and the next round level at $13.50. Momentum readings are mixed: daily MACD gives a mild buy signal, ADX at 19.41 shows a weak and indecisive trend, the RSI is neutral-to-bearish in the high 40s, Stochastic RSI is neutral, and the Commodity Channel Index is lackluster at 35.63. Bull/Bear Power currently favors buyers intraday, but the Awesome Oscillator remains neutral and does not reinforce the trend. As for daily performance, LINK opened with a slight downward gap and is trading mid-range after slipping 1.59%, while low volatility and minor post-open pressure reflect divergence between oscillators and price action.
Sideways trading favored as momentum for breakout remains limited
For the week ahead, LINK is expected to trade between $12.00 and $14.00, reflecting typical volatility for current levels. Based on higher timeframe signals, there is a low probability (under 20%) of a significant price rally, making further downside more likely in the short term. The base case is a sideways move in a $12.00 – $14.00 corridor as buyers and sellers compete for direction. A break above $14.00 would require a clear momentum surge, while a sustained drop below $12.00 could trigger renewed long-term selling pressure.
Previously it was reported that Chainlink is exhibiting short- to medium-term bullish momentum as it trades above its 20- and 50-day moving averages, but faces sustained overhead resistance with its price remaining below the longer-term 200-day average. Indicators are mixed—daily MACD is bullish while trend strength is weak and RSI is neutral to slightly positive—implying potential for sideways action within a defined range, with key support near the Ichimoku Kijun and resistance near the $13.50 level.








-
 Afghanistan
-
 Albania
-
 Algeria
-
 Angola
-
 Argentina
-
 Armenia
-
 Australia
-
 Austria
-
 Azerbaijan
-
 Bahamas
-
 Bahrain
-
 Bangladesh
-
 Belarus
-
 Belgium
-
 Bolivia
-
 Botswana
-
 Brazil
-
 Brunei
-
 Bulgaria
-
 Cambodia
-
 Cameroon
-
 Canada
-
 Chile
Chile
-
 China
China
-
 Colombia
-
 Congo
Congo
-
 Costa Rica
-
 Cote d'Ivoire
-
 Croatia
-
 Cuba
Cuba
-
 Cyprus
-
 Czechia
-
 DR Congo
-
 Denmark
-
 Dominican Republic
-
 Ecuador
-
 Egypt
Egypt
-
 El Salvador
-
 Estonia
-
 Eswatini
-
 Ethiopia
-
 Finland
-
 France
-
 Georgia
-
 Germany
-
 Ghana
Ghana
-
 Greece
-
 Haiti
Haiti
-
 Hong Kong
-
 Hungary
-
 India
India
-
 Indonesia
-
 Iran, Islamic republic
-
 Iraq
Iraq
-
 Ireland
-
 Israel
-
 Italy
Italy
-
 Jamaica
-
 Japan
Japan
-
 Jordan
-
 Kazakhstan
-
 Kenya
Kenya
-
 Korea
Korea
-
 Kuwait
-
 Kyrgyzstan
-
 Laos
Laos
-
 Latvia
-
 Lebanon
-
 Lesotho
-
 Libya
Libya
-
 Lithuania
-
 Luxembourg
-
 Madagascar
-
 Malaysia
-
 Malta
Malta
-
 Mauritius
-
 Mexico
-
 Moldova
-
 Mongolia
-
 Montenegro
-
 Morocco
-
 Mozambique
-
 Myanmar
-
 Namibia
-
 Nepal
Nepal
-
 Netherlands
-
 New Zealand
-
 Nigeria
-
 North Macedonia
-
 Norway
-
 Oman
Oman
-
 Pakistan
-
 Palestine
-
 Panama
-
 Papua New Guinea
-
 Paraguay
-
 Peru
Peru
-
 Philippines
-
 Poland
-
 Portugal
-
 Puerto Rico
-
 Qatar
Qatar
-
 Reunion
-
 Romania
-
 Rwanda
-
 Saudi Arabia
-
 Serbia
-
 Singapore
-
 Slovakia
-
 Slovenia
-
 Somalia
-
 South Africa
-
 Spain
Spain
-
 Sri Lanka
-
 Sweden
-
 Switzerland
-
 Syria
Syria
-
 Taiwan
-
 Tajikistan
-
 Tanzania
-
 Thailand
-
 Trinidad and Tobago
-
 Tunisia
-
 Turkey
-
 UAE
UAE
-
 Uganda
-
 Ukraine
-
 United Kingdom
-
United States
-
 Uruguay
-
 Uzbekistan
-
 Venezuela
-
 Vietnam
-
 Yemen
Yemen
-
 Zambia
-
 Zimbabwe
- Forex
- Crypto











