
Tron price prediction: can bullish signals persist? TRX consolidates near resistance

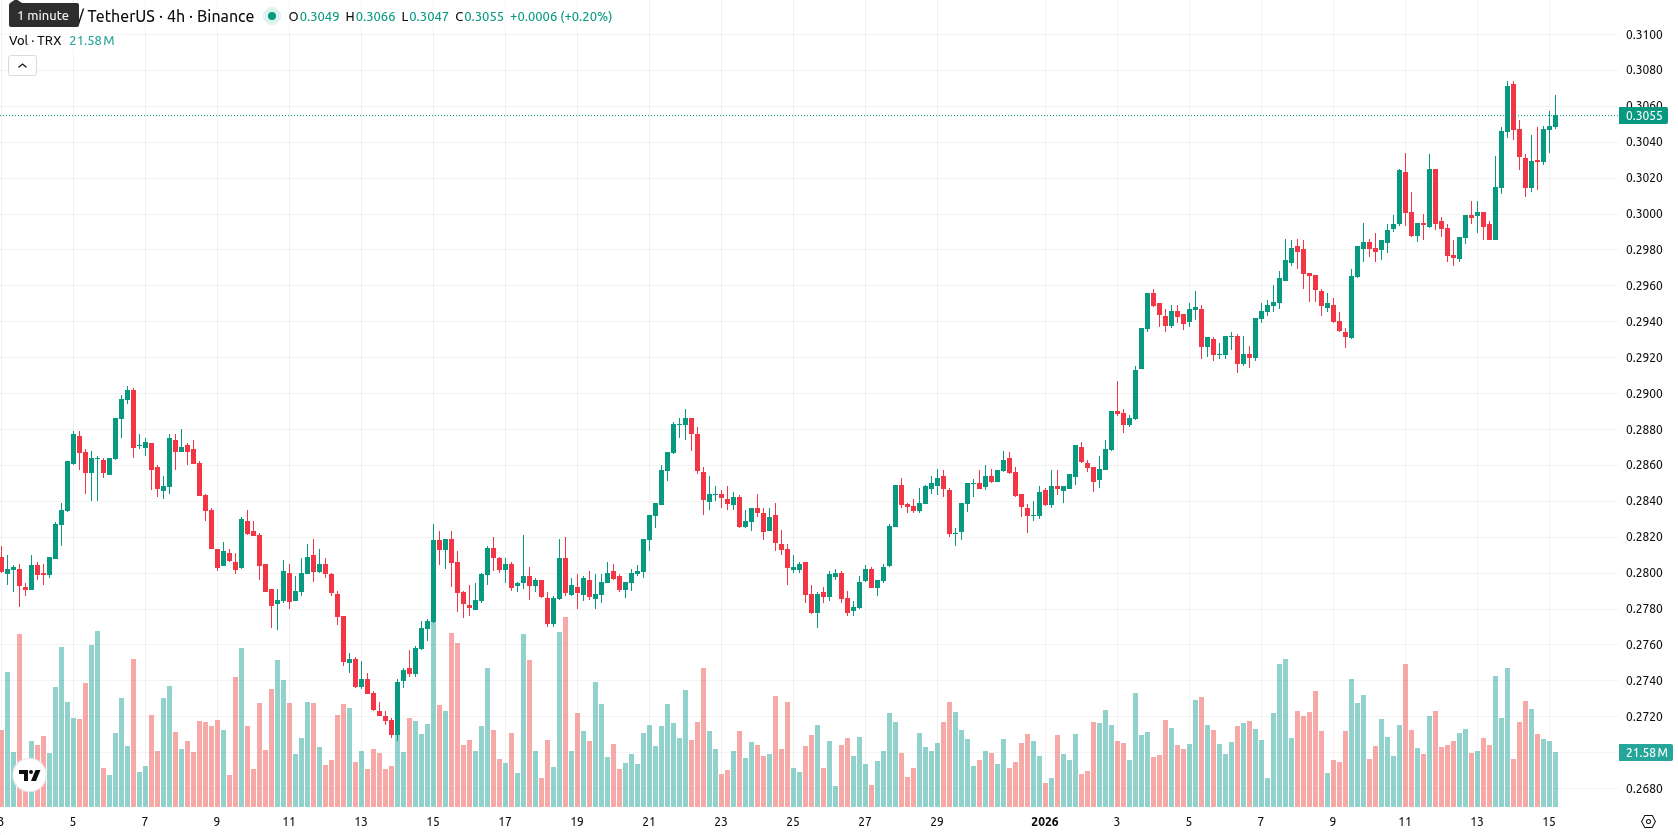
Tron (TRX) is currently trading at $0.3052, above the MA-20 ($0.2931) and MA-50 ($0.2857), but below the MA-200 ($0.3114). This reflects ongoing short- and medium-term bullish momentum for TRX, though long-term resistance remains in place.
Highlights
- Tether has frozen over $182 million in assets on the Tron blockchain, intensifying scrutiny of security and decentralization issues within the Tron network.
- Deribit exchange has launched new options for TRX, broadening institutional access and expanding the derivatives market for Tron-related products.
- Recent developments in the Tron ecosystem underscore evolving risk management strategies and growing institutional engagement in Tron-linked trading activity.
Security concerns and institutional interest as Tether freezes assets
Tether has frozen over $182 million in assets on the Tron blockchain, putting a spotlight on security and decentralization concerns within the Tron network. TRX has also seen new options launched on the Deribit exchange, broadening institutional access and expanding derivatives trading related to Tron. These developments highlight both evolving risk management practices and increasing institutional engagement across the Tron ecosystem.
Momentum divergences and overbought signals prompt caution near resistance
Technically, TRX maintains bullish momentum in the short and medium term as it trades above the MA-20 and MA-50, but faces long-term resistance under the MA-200 at $0.3114. The nearest dynamic support is set at the Ichimoku Kijun level of $0.2922, while round-number resistance can be seen near the MA-200 at $0.3114. On the daily chart, momentum signals are mostly positive: MACD signals a buy, the ADX is neutral at low strength, RSI sits at 64.70 in moderately overbought territory, and the Stochastic RSI points to a strong sell. The CCI is overbought, indicating potential short-term exhaustion, while Bull/Bear Power remains positive, confirming buying dominance, and the Awesome Oscillator supports the prevailing bullish direction. Despite low-to-moderate volatility and intraday buying strength, the divergence between bullish momentum and overbought oscillators suggests traders should show caution.
High probability of consolidation with potential for breakout or retracement
Over the next 5 trading days, TRX is expected to remain within the typical volatility band of $0.3030 to $0.3125. The probability of an upward price move is high, supported by weekly buy signals from moving averages, RSI, and ADX. Most likely, price action will consolidate between immediate support at $0.3030 and resistance near $0.3114 – $0.3125. A break above $0.3125 could open the way for additional gains, while a sustained decline below $0.3030 would increase the risk of a retracement toward the Kijun support at $0.2922.
Previously it was reported that Tron is exhibiting short- and medium-term bullish momentum, with the price trading above its 20- and 50-day moving averages but just below the 200-day moving average, indicating minor longer-term resistance. Momentum indicators, including MACD and the Awesome Oscillator, support the prevailing upward bias, though overbought signals and low ADX suggest the trend lacks strong conviction, with immediate support at $0.2917 and resistance near $0.3113.


-
 Afghanistan
-
 Albania
-
 Algeria
-
 Angola
-
 Argentina
-
 Armenia
-
 Australia
-
 Austria
-
 Azerbaijan
-
 Bahamas
-
 Bahrain
-
 Bangladesh
-
 Belarus
-
 Belgium
-
 Bolivia
-
 Botswana
-
 Brazil
-
 Brunei
-
 Bulgaria
-
 Cambodia
-
 Cameroon
-
 Canada
-
 Chile
Chile
-
 China
China
-
 Colombia
-
 Congo
Congo
-
 Costa Rica
-
 Cote d'Ivoire
-
 Croatia
-
 Cuba
Cuba
-
 Cyprus
-
 Czechia
-
 DR Congo
-
 Denmark
-
 Dominican Republic
-
 Ecuador
-
 Egypt
Egypt
-
 El Salvador
-
 Estonia
-
 Eswatini
-
 Ethiopia
-
 Finland
-
 France
-
 Georgia
-
 Germany
-
 Ghana
Ghana
-
 Greece
-
 Haiti
Haiti
-
 Hong Kong
-
 Hungary
-
 India
India
-
 Indonesia
-
 Iran, Islamic republic
-
 Iraq
Iraq
-
 Ireland
-
 Israel
-
 Italy
Italy
-
 Jamaica
-
 Japan
Japan
-
 Jordan
-
 Kazakhstan
-
 Kenya
Kenya
-
 Korea
Korea
-
 Kuwait
-
 Kyrgyzstan
-
 Laos
Laos
-
 Latvia
-
 Lebanon
-
 Lesotho
-
 Libya
Libya
-
 Lithuania
-
 Luxembourg
-
 Madagascar
-
 Malaysia
-
 Malta
Malta
-
 Mauritius
-
 Mexico
-
 Moldova
-
 Mongolia
-
 Montenegro
-
 Morocco
-
 Mozambique
-
 Myanmar
-
 Namibia
-
 Nepal
Nepal
-
 Netherlands
-
 New Zealand
-
 Nigeria
-
 North Macedonia
-
 Norway
-
 Oman
Oman
-
 Pakistan
-
 Palestine
-
 Panama
-
 Papua New Guinea
-
 Paraguay
-
 Peru
Peru
-
 Philippines
-
 Poland
-
 Portugal
-
 Puerto Rico
-
 Qatar
Qatar
-
 Reunion
-
 Romania
-
 Rwanda
-
 Saudi Arabia
-
 Serbia
-
 Singapore
-
 Slovakia
-
 Slovenia
-
 Somalia
-
 South Africa
-
 Spain
Spain
-
 Sri Lanka
-
 Sweden
-
 Switzerland
-
 Syria
Syria
-
 Taiwan
-
 Tajikistan
-
 Tanzania
-
 Thailand
-
 Trinidad and Tobago
-
 Tunisia
-
 Turkey
-
 UAE
UAE
-
 Uganda
-
 Ukraine
-
 United Kingdom
-
United States
-
 Uruguay
-
 Uzbekistan
-
 Venezuela
-
 Vietnam
-
 Yemen
Yemen
-
 Zambia
-
 Zimbabwe
- Forex
- Crypto
