
-7.03% for Flow — momentum gauges confirm downside pressure and weak recovery odds

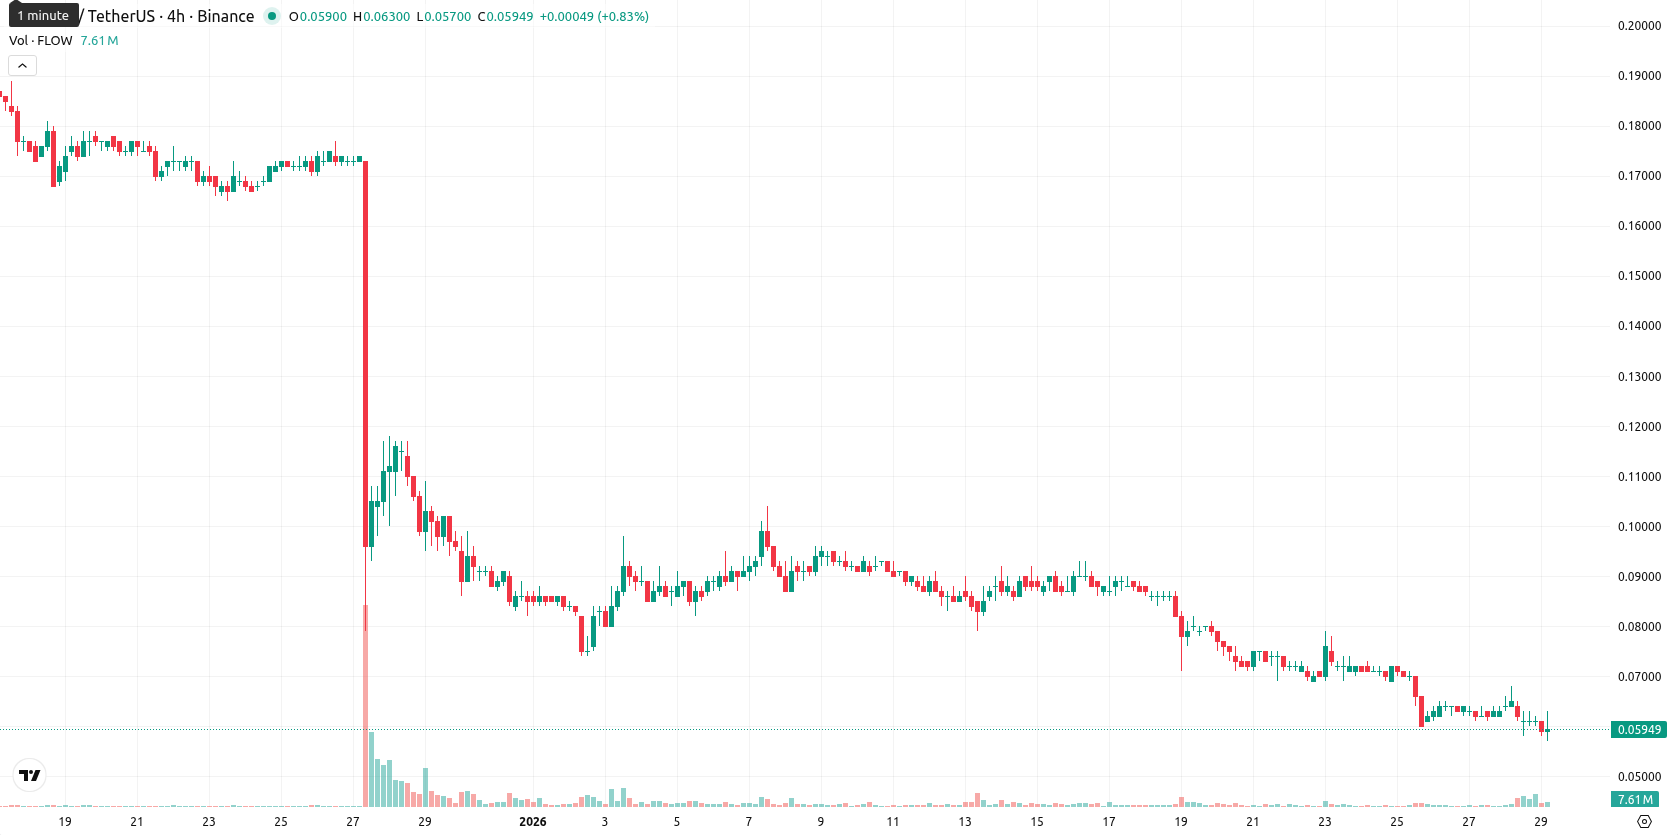
Flow (FLOW) is trading at $0.0595 after daily losses of 7.03%. The asset remains well below its MA-20 at $0.0781, MA-50 at $0.1173, and MA-200 at $0.2815, underscoring continued downside pressure both short- and long-term.
Highlights
- FLOW trades at $0.0595, significantly beneath its MA-20 ($0.0781), MA-50 ($0.1173), and MA-200 ($0.2815), reflecting persistent technical weakness.
- Momentum indicators including MACD, ADX, and RSI signal a strong, oversold downtrend, with the RSI at 18.76 and daily losses of 7.03%.
- Key technical levels are resistance at the Ichimoku Kijun ($0.0815) and support at $0.054; probability of a bullish reversal is below 20%.
Oversold momentum intensifies as FLOW tests weak intraday support
Technically, FLOW faces persistent bearish pressure as it struggles beneath key moving averages, with resistance aligned to the Ichimoku Kijun at $0.0815 and no strong dynamic support defined. Momentum remains negative: MACD points to a strong sell, ADX is elevated, while the RSI sits deeply oversold at 18.76. Stochastic RSI and CCI also confirm pronounced oversold conditions, and Bull/Bear Power supports continued seller dominance intraday. The current price hovers near today’s low of $0.058 after an uneventful open, with momentum indicators matching the asset’s intraday weakness.
Downside risk dominates as breakout above resistance remains unlikely
In the short term, FLOW is expected to trade within a typical volatility band of $0.054 to $0.063 over the next five trading days. The probability of an upward move remains under 20%, favoring further downside. A neutral scenario would see prices drift sideways near current levels, while a break above $0.063 and the Ichimoku Kijun could open a path to recovery. Risk remains skewed to the downside, with a bearish scenario likely if $0.054 support fails.
Flow (FLOW) remains under strong downward pressure, trading well below all key moving averages with technical indicators such as the MACD, ADX, RSI, and CCI confirming a persistent bearish trend and deeply oversold conditions. The lack of nearby support and the presence of resistance at the Ichimoku Kijun level indicate that sellers continue to dominate and further downside risk prevails.


Latest FLOW News


-
 Afghanistan
-
 Albania
-
 Algeria
-
 Angola
-
 Argentina
-
 Armenia
-
 Australia
-
 Austria
-
 Azerbaijan
-
 Bahamas
-
 Bahrain
-
 Bangladesh
-
 Belarus
-
 Belgium
-
 Bolivia
-
 Botswana
-
 Brazil
-
 Brunei
-
 Bulgaria
-
 Cambodia
-
 Cameroon
-
 Canada
-
 Chile
Chile
-
 China
China
-
 Colombia
-
 Congo
Congo
-
 Costa Rica
-
 Cote d'Ivoire
-
 Croatia
-
 Cuba
Cuba
-
 Cyprus
-
 Czechia
-
 DR Congo
-
 Denmark
-
 Dominican Republic
-
 Ecuador
-
 Egypt
Egypt
-
 El Salvador
-
 Estonia
-
 Eswatini
-
 Ethiopia
-
 Finland
-
 France
-
 Georgia
-
 Germany
-
 Ghana
Ghana
-
 Greece
-
 Haiti
Haiti
-
 Hong Kong
-
 Hungary
-
 India
India
-
 Indonesia
-
 Iran, Islamic republic
-
 Iraq
Iraq
-
 Ireland
-
 Israel
-
 Italy
Italy
-
 Jamaica
-
 Japan
Japan
-
 Jordan
-
 Kazakhstan
-
 Kenya
Kenya
-
 Korea
Korea
-
 Kuwait
-
 Kyrgyzstan
-
 Laos
Laos
-
 Latvia
-
 Lebanon
-
 Lesotho
-
 Libya
Libya
-
 Lithuania
-
 Luxembourg
-
 Madagascar
-
 Malaysia
-
 Malta
Malta
-
 Mauritius
-
 Mexico
-
 Moldova
-
 Mongolia
-
 Montenegro
-
 Morocco
-
 Mozambique
-
 Myanmar
-
 Namibia
-
 Nepal
Nepal
-
 Netherlands
-
 New Zealand
-
 Nigeria
-
 North Macedonia
-
 Norway
-
 Oman
Oman
-
 Pakistan
-
 Palestine
-
 Panama
-
 Papua New Guinea
-
 Paraguay
-
 Peru
Peru
-
 Philippines
-
 Poland
-
 Portugal
-
 Puerto Rico
-
 Qatar
Qatar
-
 Reunion
-
 Romania
-
 Rwanda
-
 Saudi Arabia
-
 Serbia
-
 Singapore
-
 Slovakia
-
 Slovenia
-
 Somalia
-
 South Africa
-
 Spain
Spain
-
 Sri Lanka
-
 Sweden
-
 Switzerland
-
 Syria
Syria
-
 Taiwan
-
 Tajikistan
-
 Tanzania
-
 Thailand
-
 Trinidad and Tobago
-
 Tunisia
-
 Turkey
-
 UAE
UAE
-
 Uganda
-
 Ukraine
-
 United Kingdom
-
United States
-
 Uruguay
-
 Uzbekistan
-
 Venezuela
-
 Vietnam
-
 Yemen
Yemen
-
 Zambia
-
 Zimbabwe
- Forex
- Crypto
