
PEPE weekly report: downtrend continues — resistance at $0.0000045 limits recovery prospects

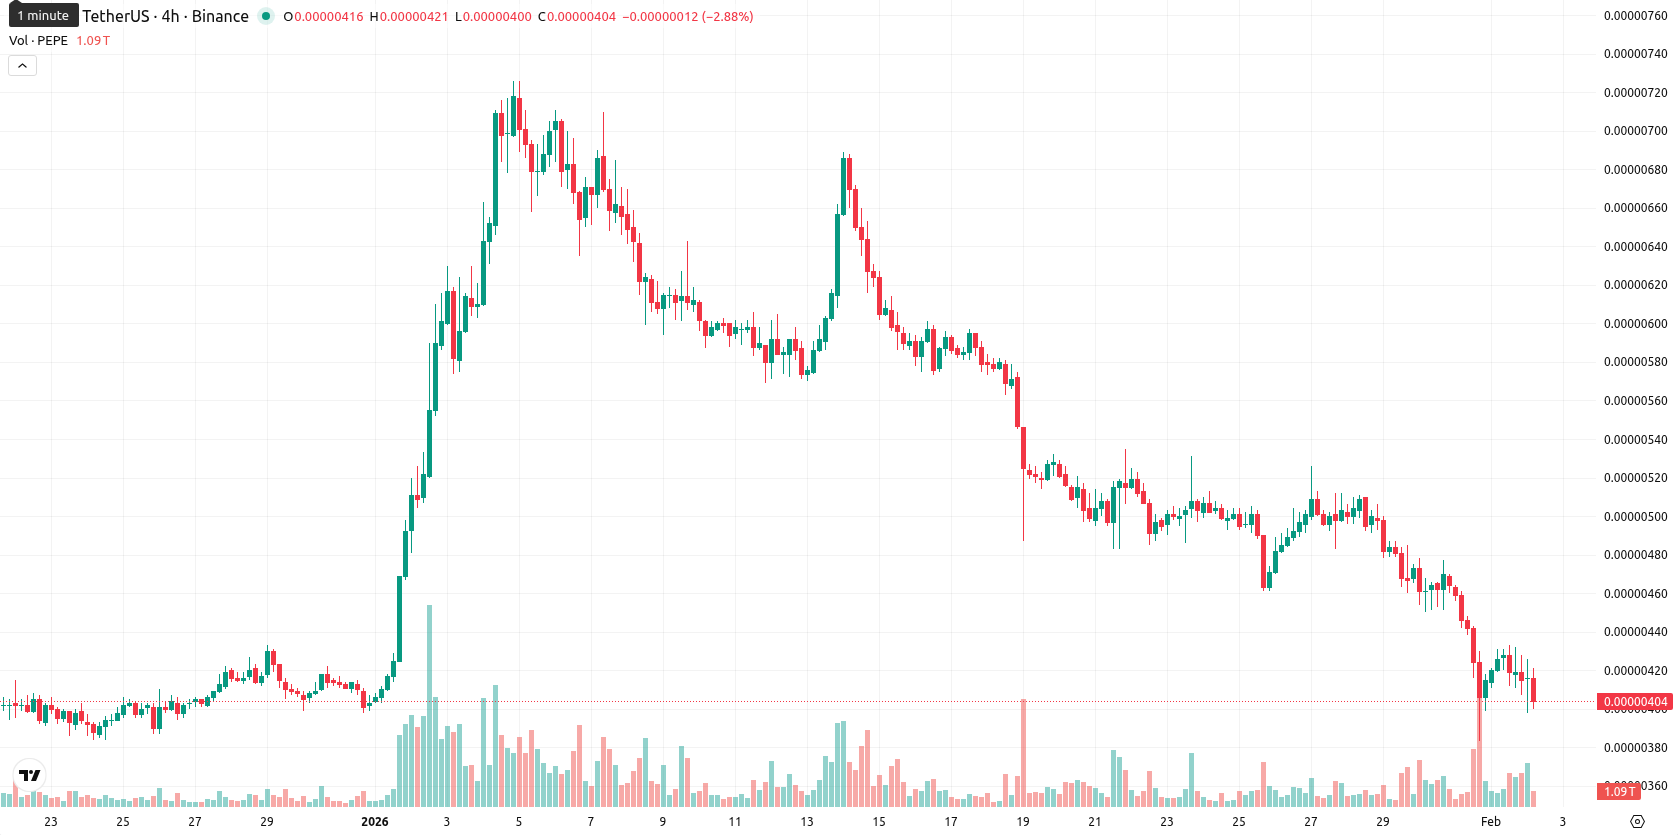
Pepe (PEPE) is currently trading at $0.0000041, having declined by $0.00000016 or 3.8% over the past week. The asset remains well below its key weekly moving averages — MA-20 ($0.00000519), MA-50 ($0.00000501), and MA-200 ($0.00000769) — confirming persistent bearish pressure on the weekly timeframe.
Highlights
- PEPE trades at $0.0000041, below MA-20, MA-50, and MA-200, confirming strong bearish pressure across all timeframes.
- Momentum indicators—MACD, RSI (34.36), CCI (–139.32), Stochastic RSI (8.93)—are bearish and oversold, with sellers maintaining dominance per Bull/Bear Power and Awesome Oscillator.
- Price is expected to consolidate within $0.0000040–$0.0000049 over the next five days, with a higher probability of further declines than sustained recovery.
Bearish momentum prevails as technical indicators confirm oversold conditions
On the W1 chart, PEPE trades near the lower end of its weekly range of $0.0000040–$0.0000043. The Ichimoku Kijun sits overhead at $0.00000546, acting as dynamic resistance, while support is likely just above $0.0000040. Momentum indicators reinforce a bearish outlook: RSI stands at 34.36 (oversold), CCI is deeply negative at –139.32, and the Stochastic RSI reads 8.93, also in oversold territory. MACD and Bull/Bear Power point to continued dominance by sellers, and the Awesome Oscillator remains aligned with the current downtrend.
Sideways consolidation expected as bearish outlook limits upside next week
PEPE is likely to consolidate within the $0.0000040–$0.0000049 range over the next five to seven trading days, with a baseline expectation of sideways movement and moderate volatility. Bullish momentum would require a sustained break above $0.0000045–$0.0000049, which appears unlikely with current weekly signals. If PEPE falls below $0.0000040, further downside could develop, given ongoing bearish momentum and the lack of supporting news catalysts.
Previously it was reported that Pepe (PEPE) is under sustained selling pressure, trading near daily lows and remaining below all key moving averages, with technical indicators including RSI, MACD, and oscillators confirming a persistently bearish momentum and oversold conditions. Resistance is defined near the Ichimoku Kijun level, and despite the oversold signals, there are no indications of an imminent bullish reversal as sellers retain control.


-
 Afghanistan
-
 Albania
-
 Algeria
-
 Angola
-
 Argentina
-
 Armenia
-
 Australia
-
 Austria
-
 Azerbaijan
-
 Bahamas
-
 Bahrain
-
 Bangladesh
-
 Belarus
-
 Belgium
-
 Bolivia
-
 Botswana
-
 Brazil
-
 Brunei
-
 Bulgaria
-
 Cambodia
-
 Cameroon
-
 Canada
-
 Chile
Chile
-
 China
China
-
 Colombia
-
 Congo
Congo
-
 Costa Rica
-
 Cote d'Ivoire
-
 Croatia
-
 Cuba
Cuba
-
 Cyprus
-
 Czechia
-
 DR Congo
-
 Denmark
-
 Dominican Republic
-
 Ecuador
-
 Egypt
Egypt
-
 El Salvador
-
 Estonia
-
 Eswatini
-
 Ethiopia
-
 Finland
-
 France
-
 Georgia
-
 Germany
-
 Ghana
Ghana
-
 Greece
-
 Haiti
Haiti
-
 Hong Kong
-
 Hungary
-
 India
India
-
 Indonesia
-
 Iran, Islamic republic
-
 Iraq
Iraq
-
 Ireland
-
 Israel
-
 Italy
Italy
-
 Jamaica
-
 Japan
Japan
-
 Jordan
-
 Kazakhstan
-
 Kenya
Kenya
-
 Korea
Korea
-
 Kuwait
-
 Kyrgyzstan
-
 Laos
Laos
-
 Latvia
-
 Lebanon
-
 Lesotho
-
 Libya
Libya
-
 Lithuania
-
 Luxembourg
-
 Madagascar
-
 Malaysia
-
 Malta
Malta
-
 Mauritius
-
 Mexico
-
 Moldova
-
 Mongolia
-
 Montenegro
-
 Morocco
-
 Mozambique
-
 Myanmar
-
 Namibia
-
 Nepal
Nepal
-
 Netherlands
-
 New Zealand
-
 Nigeria
-
 North Macedonia
-
 Norway
-
 Oman
Oman
-
 Pakistan
-
 Palestine
-
 Panama
-
 Papua New Guinea
-
 Paraguay
-
 Peru
Peru
-
 Philippines
-
 Poland
-
 Portugal
-
 Puerto Rico
-
 Qatar
Qatar
-
 Reunion
-
 Romania
-
 Rwanda
-
 Saudi Arabia
-
 Serbia
-
 Singapore
-
 Slovakia
-
 Slovenia
-
 Somalia
-
 South Africa
-
 Spain
Spain
-
 Sri Lanka
-
 Sweden
-
 Switzerland
-
 Syria
Syria
-
 Taiwan
-
 Tajikistan
-
 Tanzania
-
 Thailand
-
 Trinidad and Tobago
-
 Tunisia
-
 Turkey
-
 UAE
UAE
-
 Uganda
-
 Ukraine
-
 United Kingdom
-
United States
-
 Uruguay
-
 Uzbekistan
-
 Venezuela
-
 Vietnam
-
 Yemen
Yemen
-
 Zambia
-
 Zimbabwe
- Forex
- Crypto
