

Bearish indicators and strong seller pressure — Rocket Pool drops 7.18%

Rocket Pool (RPL) is trading at $1.68, notably below its MA-20 at $2.0030, MA-50 at $2.0040, and MA-200 at $4.2747, highlighting persistent seller pressure across short, medium, and long-term timeframes. The closest dynamic resistance is the Ichimoku Kijun at $1.9750, while no immediate dynamic supports are evident in current market conditions.
RPL price prediction
Current price:
$1.197
-0.01
0.83%
Real-time Data
19:10
Daily range
1.144
 1.208
1.208
Weekly range
1.1290
1.3880
1.3880
Loading...
Highlights
- RPL is trading at $1.68, significantly below its MA-20 ($2.0030), MA-50 ($2.0040), and MA-200 ($4.2747), indicating sustained bearish pressure across timeframes.
- Momentum indicators—including MACD (sell), ADX (weak trend), and Awesome Oscillator—confirm persistent downward movement, with CCI deeply oversold at -120.32 and high intraday volatility.
- The price is likely to remain in the $1.60–$1.85 range over the next five days, with a sub-20% probability of a bullish breakout above the $1.98 resistance.
Bearish momentum affirmed as oscillators align with weak trend strength
Momentum is negative with both the MACD (sell forecast) and ADX indicating weak trend strength. RSI stands at 37.18 (D1), showing mild bearish momentum but not yet deeply oversold, while the CCI is firmly oversold at -120.32, and the Stochastic RSI registers a relatively neutral 26.29. Bull/Bear Power remains slightly negative, signaling ongoing seller dominance intraday. The Awesome Oscillator supports this downward trend. RPL opened slightly below the prior close with no significant gap and currently trades near the intraday low of the $1.68 – $1.80 range. Volatility is high, and price action shows consistent pressure after the open. This aligns with the prevailing bearish momentum in daily indicators, with no significant divergences among the oscillators.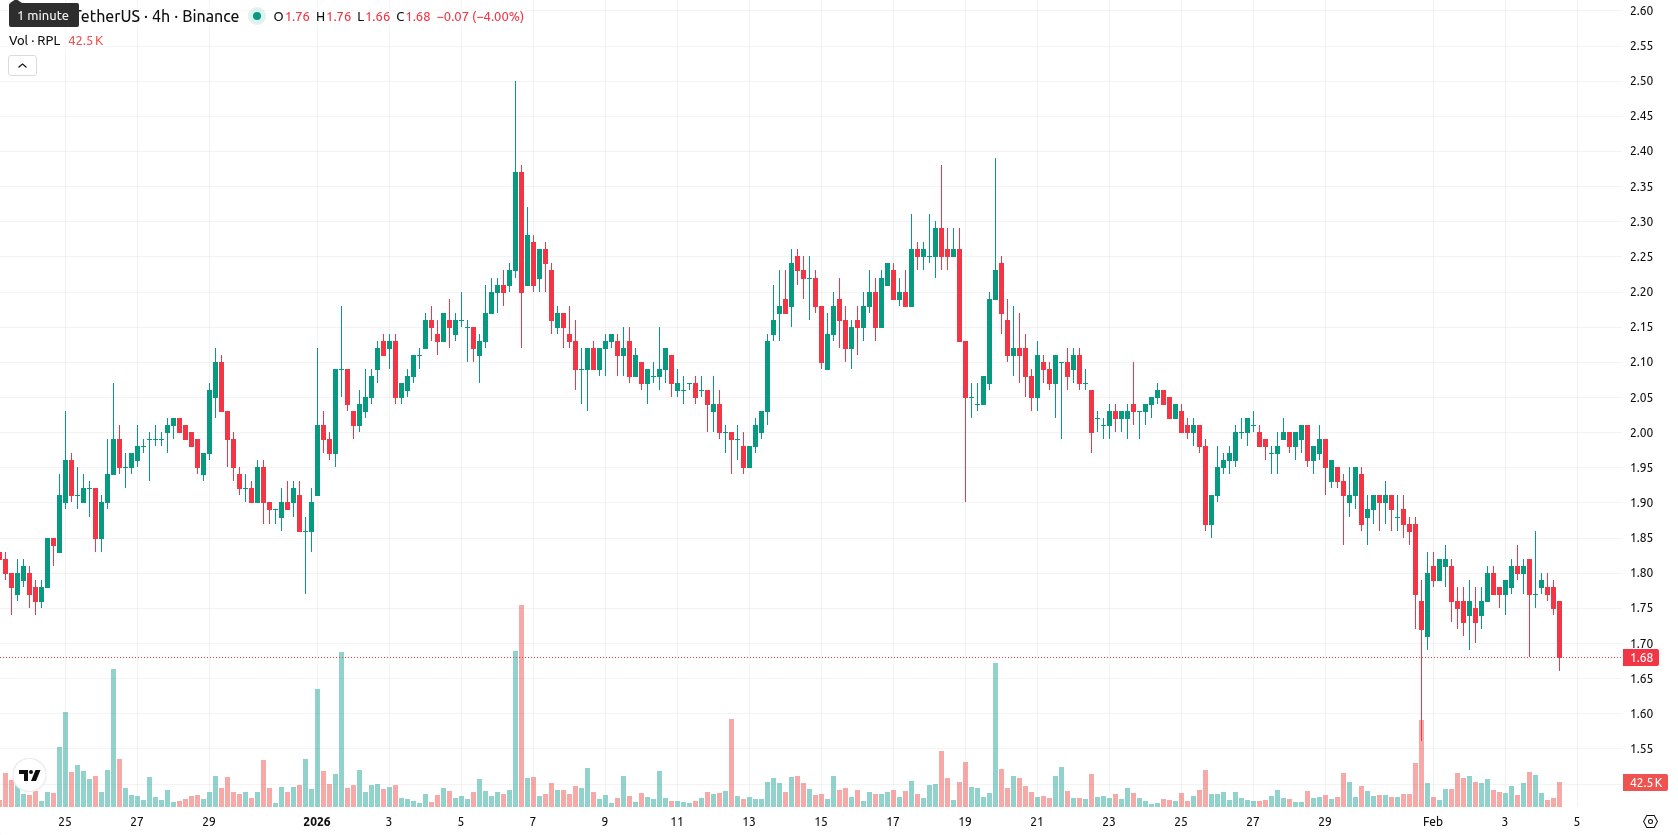
Lower price risk grows as sideways-to-down trend dominates outlook
For the coming five trading days, the expected price range is $1.60 to $1.85, reflecting a volatility band relative to current levels. The probability of a rise in price is very low (less than 20%), so a further decline is much more likely in the short term. The baseline scenario sees RPL maintaining a sideways-to-lower corridor between $1.60 and $1.85. A bullish scenario would require a decisive break above the $1.98 resistance (Ichimoku Kijun), while a bearish outcome would see the price slipping below $1.60, exposing the token to deeper losses should seller pressure accelerate.
Viktoras Karapetjanc, analyst at Traders Union, sees Rocket Pool locked in a bearish short-term pattern. He notes that persistent sell pressure and a lack of positive news are weighing heavily on sentiment. Indicators signal oversold conditions, but macro and market flows are not yet supportive of a rebound. While Karapetjanc takes a cautiously optimistic view for the medium term, he remains patient here. "I am watching for a break above $1.98 to signal a possible momentum shift — until then, staying constructive but on the sidelines."
Previously it was reported that Rocket Pool remains in a sustained downtrend, trading below all major moving averages, with key technical indicators including MACD, ADX, and RSI reflecting weak buyer momentum and oversold conditions. Resistance is defined by the Ichimoku Kijun at $2.03, while limited support and constrained upside suggest continued sideways or lower price action within a narrow range.
Source of Data:
RPL Price Analysis by TU
The analysis is based on a proprietary model combining technical, on-chain, and expert data. Not investment advice. See
methodology
The information is based on forecasts and does not constitute investment advice or a guarantee of future results. Market conditions may change. See our Disclaimer and Editorial Integrity for details.
Subscribe to TU news


Did you like the article?






Top News


Top 5 companies for you

United States
-
 Afghanistan
-
 Albania
-
 Algeria
-
 Angola
-
 Argentina
-
 Armenia
-
 Australia
-
 Austria
-
 Azerbaijan
-
 Bahamas
-
 Bahrain
-
 Bangladesh
-
 Belarus
-
 Belgium
-
 Bolivia
-
 Botswana
-
 Brazil
-
 Brunei
-
 Bulgaria
-
 Cambodia
-
 Cameroon
-
 Canada
-
 Chile
-
 China
-
 Colombia
-
 Congo
-
 Costa Rica
-
 Cote d'Ivoire
-
 Croatia
-
 Cuba
-
 Cyprus
-
 Czechia
-
 DR Congo
-
 Denmark
-
 Dominican Republic
-
 Ecuador
-
 Egypt
-
 El Salvador
-
 Estonia
-
 Eswatini
-
 Ethiopia
-
 Finland
-
 France
-
 Georgia
-
 Germany
-
 Ghana
-
 Greece
-
 Haiti
-
 Hong Kong
-
 Hungary
-
 India
-
 Indonesia
-
 Iran, Islamic republic
-
 Iraq
-
 Ireland
-
 Israel
-
 Italy
-
 Jamaica
-
 Japan
-
 Jordan
-
 Kazakhstan
-
 Kenya
-
 Korea
-
 Kuwait
-
 Kyrgyzstan
-
 Laos
-
 Latvia
-
 Lebanon
-
 Lesotho
-
 Libya
-
 Lithuania
-
 Luxembourg
-
 Madagascar
-
 Malaysia
-
 Malta
-
 Mauritius
-
 Mexico
-
 Moldova
-
 Mongolia
-
 Montenegro
-
 Morocco
-
 Mozambique
-
 Myanmar
-
 Namibia
-
 Nepal
-
 Netherlands
-
 New Zealand
-
 Nigeria
-
 North Macedonia
-
 Norway
-
 Oman
-
 Pakistan
-
 Palestine
-
 Panama
-
 Papua New Guinea
-
 Paraguay
-
 Peru
-
 Philippines
-
 Poland
-
 Portugal
-
 Puerto Rico
-
 Qatar
-
 Reunion
-
 Romania
-
 Rwanda
-
 Saudi Arabia
-
 Serbia
-
 Singapore
-
 Slovakia
-
 Slovenia
-
 Somalia
-
 South Africa
-
 Spain
-
 Sri Lanka
-
 Sweden
-
 Switzerland
-
 Syria
-
 Taiwan
-
 Tajikistan
-
 Tanzania
-
 Thailand
-
 Trinidad and Tobago
-
 Tunisia
-
 Turkey
-
 UAE
-
 Uganda
-
 Ukraine
-
 United Kingdom
-
United States
-
 Uruguay
-
 Uzbekistan
-
 Venezuela
-
 Vietnam
-
 Yemen
-
 Zambia
-
 Zimbabwe
- Forex
- Crypto










Live News


