
Starknet price prediction: Downtrend persists as STRK struggles below resistance

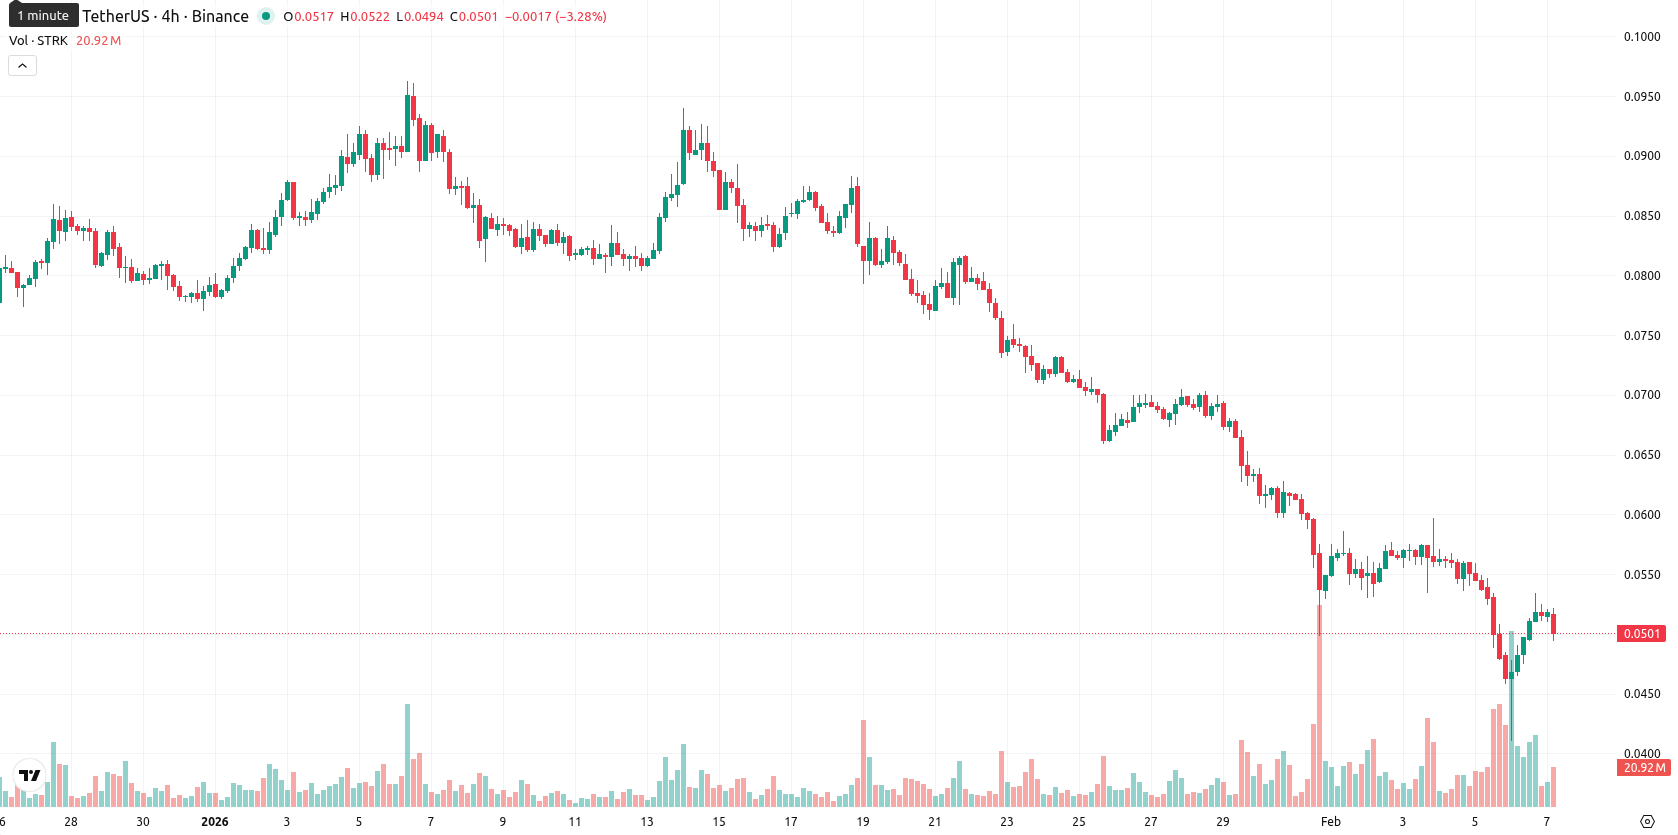
Starknet (STRK) is trading at $0.0497 after an intraday gain of 3.33%, yet remains well below the MA-20 ($0.0657), MA-50 ($0.0764), and MA-200 ($0.1179), underscoring continued bearish sentiment and persistent pressure from sellers across all timeframes.
 0.029
0.0300
0.029
0.0300
Highlights
- STRK trades at $0.0497, significantly below MA-20 ($0.0657), MA-50 ($0.0764), and MA-200 ($0.1179), confirming persistent multi-timeframe selling pressure.
- Bearish momentum prevails with MACD and ADX signaling further downside, while RSI and CCI remain in oversold territory and Stochastic RSI shows potential for a short-term rebound.
- Expected five-session price range is $0.0450 to $0.0540; a sustained increase is unlikely (<20% probability) unless a breakout above $0.0540 occurs.
Downtrend pressure as oversold signals clash with weak momentum
Technically, STRK faces strong resistance set by the Ichimoku Kijun at $0.0678, with support defined by its current trading range. There is no golden or death cross emerging. Momentum indicators remain bearish: the MACD and Average Directional Index reinforce selling pressure, while both RSI and the Commodity Channel Index are deep in oversold territory. Stochastic RSI signals a potential short-term rebound from these low levels, but the daily Bull/Bear Power favors sellers and the Awesome Oscillator confirms the dominant downtrend. Divergence among oscillators highlights uncertainty, as oversold conditions compete with persistent downward momentum.
Limited rebound odds as volatility and bearish bias persist
Looking ahead, STRK is likely to stay within a volatility band of $0.0450 to $0.0540 over the next five sessions. The probability of a sustained upside move is very low — less than 20%. Most scenarios point to a continuation of sideways or downward movement, unless oversold signals trigger a sharp short-term recovery. A bullish breakout would require a move above $0.0540 alongside a clear reversal in momentum, while a failure to hold $0.0450 could exacerbate the prevailing decline.
Last time, analysts noted that Starknet (STRK) was trading well below its key moving averages, with persistent bearish momentum signaled by MACD and ADX, despite deeply oversold conditions confirmed by RSI, Stoch RSI, and CCI. However, an intraday recovery toward session highs and heightened volatility suggested a divergence between the ongoing negative momentum and short-term price action, with resistance observed near the Ichimoku Kijun level.








-
 Afghanistan
-
 Albania
-
 Algeria
-
 Angola
-
 Argentina
-
 Armenia
-
 Australia
-
 Austria
-
 Azerbaijan
-
 Bahamas
-
 Bahrain
-
 Bangladesh
-
 Belarus
-
 Belgium
-
 Bolivia
-
 Botswana
-
 Brazil
-
 Brunei
-
 Bulgaria
-
 Cambodia
-
 Cameroon
-
 Canada
-
 Chile
Chile
-
 China
China
-
 Colombia
-
 Congo
Congo
-
 Costa Rica
-
 Cote d'Ivoire
-
 Croatia
-
 Cuba
Cuba
-
 Cyprus
-
 Czechia
-
 DR Congo
-
 Denmark
-
 Dominican Republic
-
 Ecuador
-
 Egypt
Egypt
-
 El Salvador
-
 Estonia
-
 Eswatini
-
 Ethiopia
-
 Finland
-
 France
-
 Georgia
-
 Germany
-
 Ghana
Ghana
-
 Greece
-
 Haiti
Haiti
-
 Hong Kong
-
 Hungary
-
 India
India
-
 Indonesia
-
 Iran, Islamic republic
-
 Iraq
Iraq
-
 Ireland
-
 Israel
-
 Italy
Italy
-
 Jamaica
-
 Japan
Japan
-
 Jordan
-
 Kazakhstan
-
 Kenya
Kenya
-
 Korea
Korea
-
 Kuwait
-
 Kyrgyzstan
-
 Laos
Laos
-
 Latvia
-
 Lebanon
-
 Lesotho
-
 Libya
Libya
-
 Lithuania
-
 Luxembourg
-
 Madagascar
-
 Malaysia
-
 Malta
Malta
-
 Mauritius
-
 Mexico
-
 Moldova
-
 Mongolia
-
 Montenegro
-
 Morocco
-
 Mozambique
-
 Myanmar
-
 Namibia
-
 Nepal
Nepal
-
 Netherlands
-
 New Zealand
-
 Nigeria
-
 North Macedonia
-
 Norway
-
 Oman
Oman
-
 Pakistan
-
 Palestine
-
 Panama
-
 Papua New Guinea
-
 Paraguay
-
 Peru
Peru
-
 Philippines
-
 Poland
-
 Portugal
-
 Puerto Rico
-
 Qatar
Qatar
-
 Reunion
-
 Romania
-
 Rwanda
-
 Saudi Arabia
-
 Serbia
-
 Singapore
-
 Slovakia
-
 Slovenia
-
 Somalia
-
 South Africa
-
 Spain
Spain
-
 Sri Lanka
-
 Sweden
-
 Switzerland
-
 Syria
Syria
-
 Taiwan
-
 Tajikistan
-
 Tanzania
-
 Thailand
-
 Trinidad and Tobago
-
 Tunisia
-
 Turkey
-
 UAE
UAE
-
 Uganda
-
 Ukraine
-
 United Kingdom
-
United States
-
 Uruguay
-
 Uzbekistan
-
 Venezuela
-
 Vietnam
-
 Yemen
Yemen
-
 Zambia
-
 Zimbabwe
- Forex
- Crypto











