
TON falls 5.48% with weekly MACD and ADX confirming strong bearish trend beneath the MA-50 and MA-200 – weekly forecast

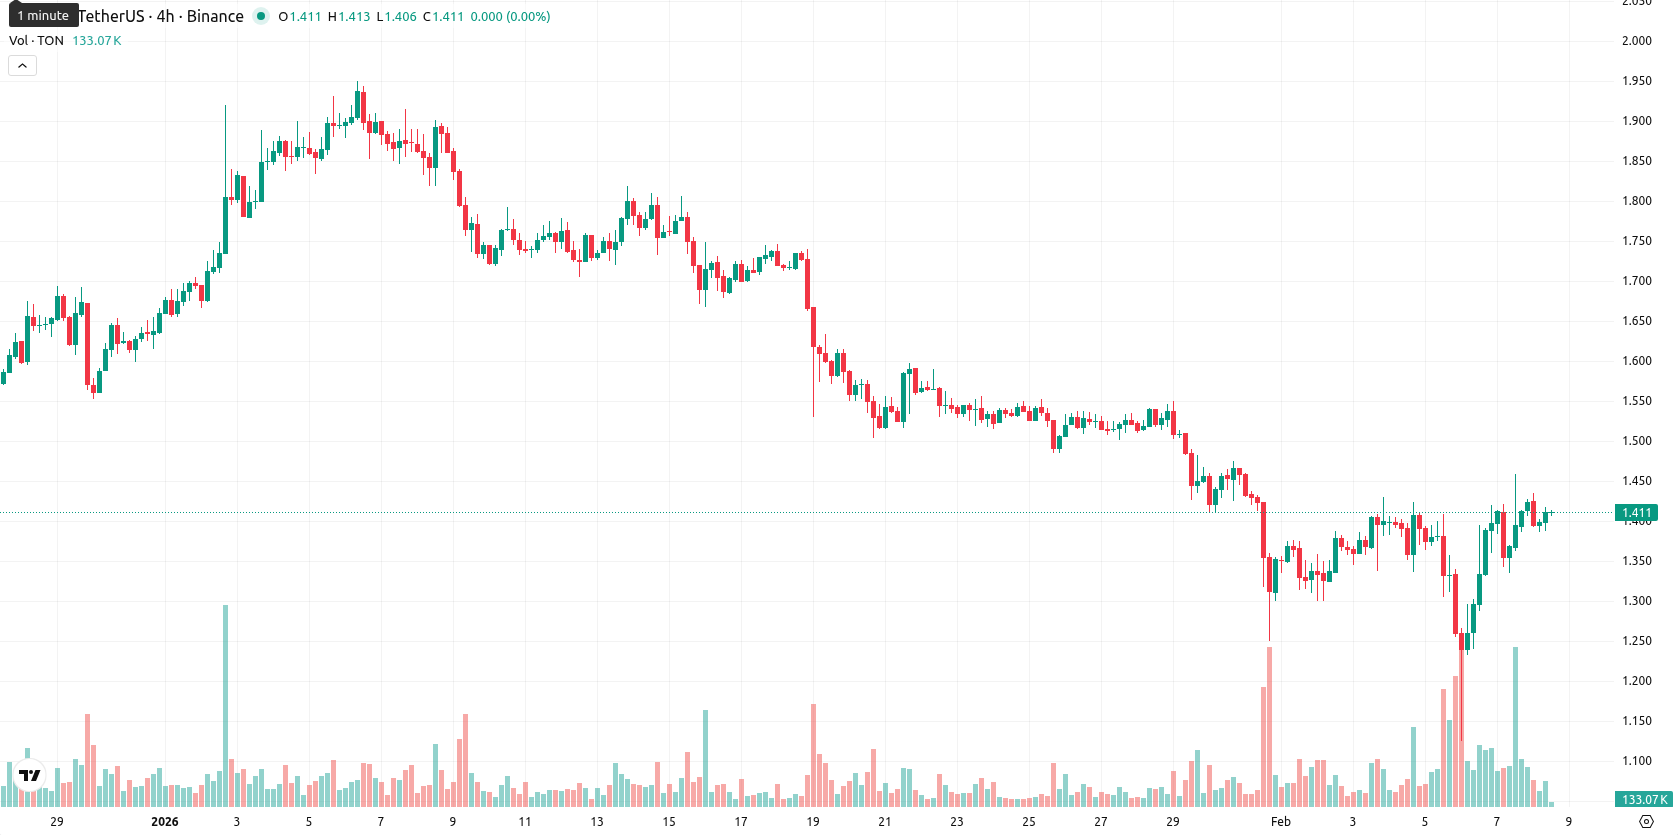
Toncoin (TON) is currently trading at $1.411, marking a weekly decline from last week. Over the past week, TON moved lower in both absolute and percentage terms, remaining below its key moving averages. It continues to trade beneath the MA-20 ($1.459), MA-50 ($1.596), and MA-200 ($2.308), highlighting persistent downward pressure across weekly timeframes.
 1.467
1.6520
1.467
1.6520
Highlights
- TON is trading at $1.411, below its MA-20 ($1.459), MA-50 ($1.596), and MA-200 ($2.308), indicating persistent downside pressure across timeframes.
- Momentum indicators including MACD and ADX show continuing sell signals, while RSI at 44.0 and an overbought Stochastic RSI suggest mixed short-term action.
- Key support is at $1.35 and resistance at $1.48, with a low probability of breakout; price is expected to remain range-bound, favoring further declines.
Bearish momentum confirmed as technical signals diverge during week
Weekly technical analysis confirms the prevailing bearish conditions for TON. The nearest dynamic support is located at $1.359, while resistance sits around the Ichimoku Kijun at $1.469 and the MA-50 at $1.596. The MACD and ADX on the weekly timeframe both provide sell signals, underscoring a strong downward trend, while the RSI stands at 44.0, reflecting neither oversold nor overbought conditions. Momentum indicators suggest consolidation is likely, with a divergence between oscillators and a moderate weekly volatility profile.
Neutral to bearish outlook as limited breakout risk guides next week
For the upcoming 5–7 trading days, the anticipated range is $1.35–$1.48, suggesting continued sideways movement near current levels. With a less than 20% probability of a sustained upside break, the baseline scenario remains neutral to bearish. Further downside movement is more likely unless TON can close decisively above $1.48, opening a path to $1.51, while a drop below support at $1.35 may lead to additional weakness.
Last time, analysts noted that Toncoin is trading below all major moving averages, with the asset showing a persistent medium- and long-term bearish bias despite a strong intraday gain reflecting short-term buyer support. Key technical indicators remain mixed, as RSI hovers above oversold, MACD and ADX signal selling pressure, and immediate resistance and support are identified near $1.47 and $1.40, respectively.


Latest GRAM News






-
 Afghanistan
-
 Albania
-
 Algeria
-
 Angola
-
 Argentina
-
 Armenia
-
 Australia
-
 Austria
-
 Azerbaijan
-
 Bahamas
-
 Bahrain
-
 Bangladesh
-
 Belarus
-
 Belgium
-
 Bolivia
-
 Botswana
-
 Brazil
-
 Brunei
-
 Bulgaria
-
 Cambodia
-
 Cameroon
-
 Canada
-
 Chile
Chile
-
 China
China
-
 Colombia
-
 Congo
Congo
-
 Costa Rica
-
 Cote d'Ivoire
-
 Croatia
-
 Cuba
Cuba
-
 Cyprus
-
 Czechia
-
 DR Congo
-
 Denmark
-
 Dominican Republic
-
 Ecuador
-
 Egypt
Egypt
-
 El Salvador
-
 Estonia
-
 Eswatini
-
 Ethiopia
-
 Finland
-
 France
-
 Georgia
-
 Germany
-
 Ghana
Ghana
-
 Greece
-
 Haiti
Haiti
-
 Hong Kong
-
 Hungary
-
 India
India
-
 Indonesia
-
 Iran, Islamic republic
-
 Iraq
Iraq
-
 Ireland
-
 Israel
-
 Italy
Italy
-
 Jamaica
-
 Japan
Japan
-
 Jordan
-
 Kazakhstan
-
 Kenya
Kenya
-
 Korea
Korea
-
 Kuwait
-
 Kyrgyzstan
-
 Laos
Laos
-
 Latvia
-
 Lebanon
-
 Lesotho
-
 Libya
Libya
-
 Lithuania
-
 Luxembourg
-
 Madagascar
-
 Malaysia
-
 Malta
Malta
-
 Mauritius
-
 Mexico
-
 Moldova
-
 Mongolia
-
 Montenegro
-
 Morocco
-
 Mozambique
-
 Myanmar
-
 Namibia
-
 Nepal
Nepal
-
 Netherlands
-
 New Zealand
-
 Nigeria
-
 North Macedonia
-
 Norway
-
 Oman
Oman
-
 Pakistan
-
 Palestine
-
 Panama
-
 Papua New Guinea
-
 Paraguay
-
 Peru
Peru
-
 Philippines
-
 Poland
-
 Portugal
-
 Puerto Rico
-
 Qatar
Qatar
-
 Reunion
-
 Romania
-
 Rwanda
-
 Saudi Arabia
-
 Serbia
-
 Singapore
-
 Slovakia
-
 Slovenia
-
 Somalia
-
 South Africa
-
 Spain
Spain
-
 Sri Lanka
-
 Sweden
-
 Switzerland
-
 Syria
Syria
-
 Taiwan
-
 Tajikistan
-
 Tanzania
-
 Thailand
-
 Trinidad and Tobago
-
 Tunisia
-
 Turkey
-
 UAE
UAE
-
 Uganda
-
 Ukraine
-
 United Kingdom
-
United States
-
 Uruguay
-
 Uzbekistan
-
 Venezuela
-
 Vietnam
-
 Yemen
Yemen
-
 Zambia
-
 Zimbabwe
- Forex
- Crypto











