
AAVE extends losses to trade well below MA-20, facing resistance at $135.39 amid oversold signals – weekly analysis

Aave (AAVE) is currently trading at $110.68, marking a decisive move lower for the week with a notable decline both in absolute terms and percentage. The asset remains well below its key weekly moving averages — MA-20 at $136.09, MA-50 at $151.58, and MA-200 at $225.22 — highlighting persistent downward pressure across all major timeframes.
AAVE price prediction
Current price:
$ 89.73
1.47
1.67%
Real-time Data
13:32
Daily range
89.04
 91.02
91.02
Weekly range
87.47
101.14
Loading...
Highlights
- AAVE is trading at $110.68, significantly below its MA-20 ($136.09), MA-50 ($151.58), and MA-200 ($225.22), reflecting entrenched bearish momentum.
- Momentum indicators including MACD, ADX, RSI, and Bull/Bear Power are all bearish and show seller dominance, with no significant bullish divergence present.
- Expected price range for the next five trading days is $108.00 to $115.00, with probability of a price increase under 20% and further declines likely if $108.00 breaks.
Resilience demonstrated amid heavy liquidations and hawkish Fed sentiment
Aave recently weathered a period of heightened volatility by successfully processing over $4.65 billion in liquidations without systemic disruption, demonstrating robust protocol resilience. Between January 31 and February 5, liquidation activity peaked above $400 million as a result of forced selling and hawkish Fed sentiment. The platform's Stress Volatility Recapture feature enabled Aave to convert $13.17 million in execution MEV into protocol treasury yields, with significant activity distributed across multiple chains including Ethereum and Polygon.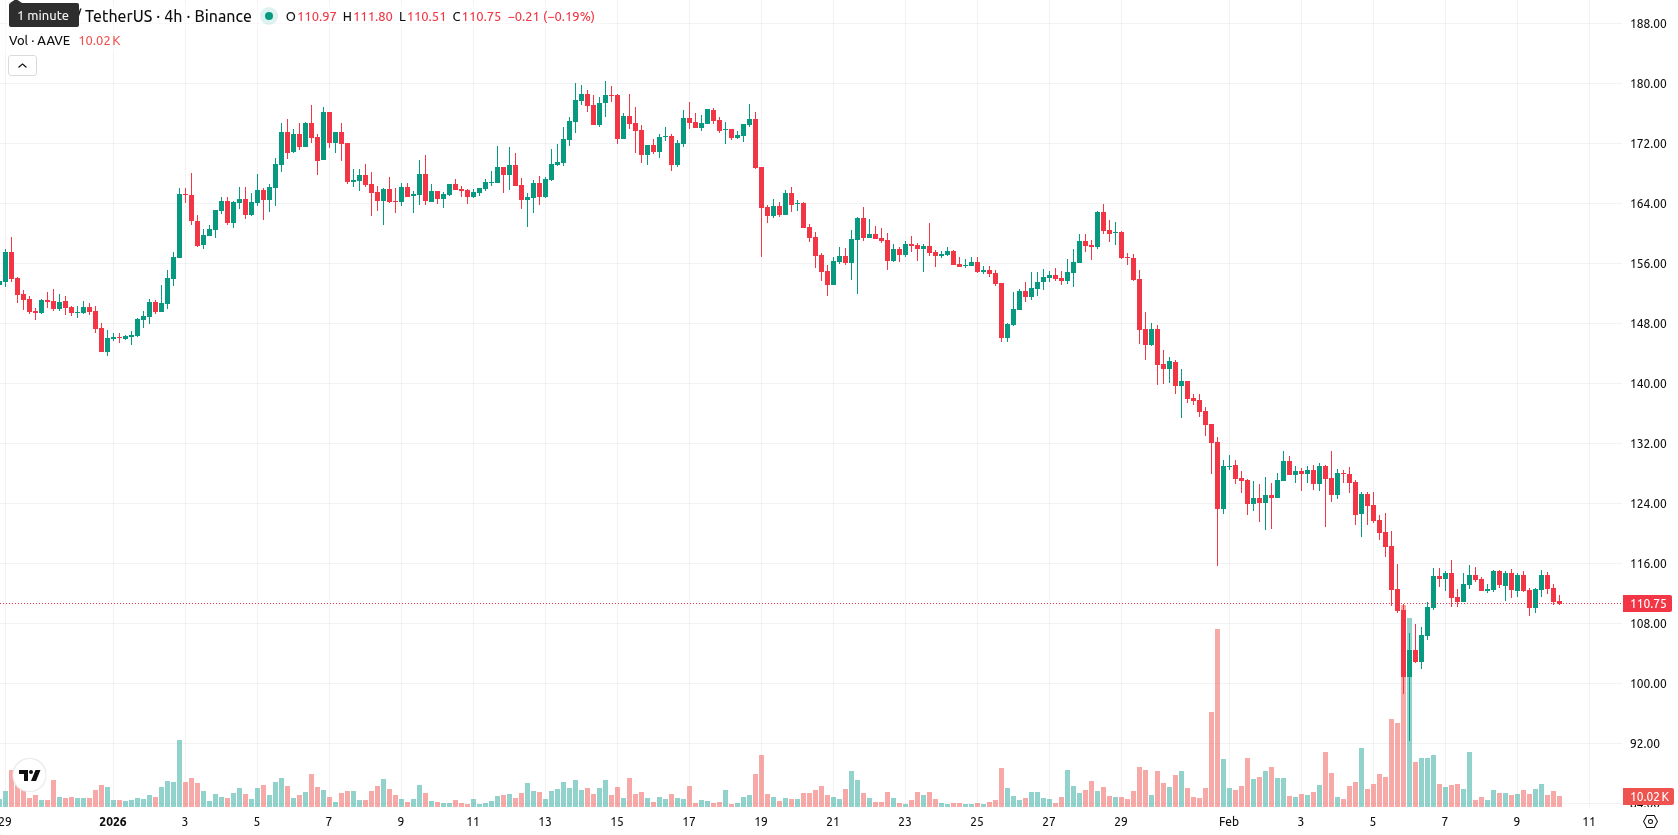
Entrenched weekly bearish momentum as technicals stay oversold
On the weekly chart, AAVE sits well beneath its MA-20 ($136.09), MA-50 ($151.58), and MA-200 ($225.22), confirming entrenched downside momentum. Immediate resistance is identified at the Ichimoku Kijun line ($135.39), while the lack of support above the cloud indicates no meaningful buffer to halt declines. Weekly RSI and CCI are in oversold territory, and major momentum indicators — including MACD, ADX, Bull/Bear Power, and the Awesome Oscillator — all point to persistent bearish strength, underscoring the sellers' dominance throughout the week.Further downside risk expected as consolidation tests lower support
Over the next 5 to 7 trading days, the price of AAVE is expected to remain under pressure, likely fluctuating between $108.00 and $115.00 as the market consolidates near recent lows. Key weekly indicators overwhelmingly favor further weakness, making a sustained price rebound unlikely (probability of less than 20%). A neutral scenario sees price drift sideways as the market searches for stabilization, while a decisive move below $108.00 would signal the onset of deeper declines. A reversal would require AAVE to break above $115.00–$120.00, restoring short-term bullish momentum.
Anton Kharitonov, expert at Traders Union, highlights that Aave posted another weak weekly close, pressured by persistent seller dominance. He notes that AAVE remains far below all key moving averages, with no robust support above $108.00 and trend indicators confirming ongoing downside momentum. The analyst emphasizes that, despite Aave’s resilience during major liquidations, price recovery remains unlikely as technical signals stay heavily bearish. Immediate resistance at the Ichimoku Kijun line near $135.39 is too distant to provide relief in the coming week. Kharitonov believes that sideways drift or deeper declines remain the highest-probability outcomes unless a strong reversal above $115.00–$120.00 emerges. "As long as AAVE trades well beneath its major averages and momentum stays negative, I remain cautious and do not anticipate a significant rebound this week."
Previously it was reported that Aave continues to trade significantly below its key moving averages, with the price action dominated by persistent selling pressure as confirmed by bearish momentum indicators such as MACD, ADX, and oversold oscillator readings including RSI and Stochastic RSI. Immediate resistance lies at the Ichimoku Kijun level while the probability of a meaningful breakout remains low, suggesting further downside or range-bound consolidation in the near term.
Source of Data:
AAVE Price Analysis by TU
The analysis is based on a proprietary model combining technical, on-chain, and expert data. Not investment advice. See
methodology
This material may contain third-party opinions, none of the data and information on this webpage constitutes investment advice according to our Disclaimer. While we adhere to strict Editorial Integrity, this post may contain references to products from our partners.
Subscribe to TU news

Did you like the article?


Weekly Top Bonuses

Top News


Top 5 companies for you

United States
-
 Afghanistan
-
 Albania
-
 Algeria
-
 Angola
-
 Argentina
-
 Armenia
-
 Australia
-
 Austria
-
 Azerbaijan
-
 Bahamas
-
 Bahrain
-
 Bangladesh
-
 Belarus
-
 Belgium
-
 Bolivia
-
 Botswana
-
 Brazil
-
 Brunei
-
 Bulgaria
-
 Cambodia
-
 Cameroon
-
 Canada
-
 Chile
Chile
-
 China
China
-
 Colombia
-
 Congo
Congo
-
 Costa Rica
-
 Cote d'Ivoire
-
 Croatia
-
 Cuba
Cuba
-
 Cyprus
-
 Czechia
-
 DR Congo
-
 Denmark
-
 Dominican Republic
-
 Ecuador
-
 Egypt
Egypt
-
 El Salvador
-
 Estonia
-
 Eswatini
-
 Ethiopia
-
 Finland
-
 France
-
 Georgia
-
 Germany
-
 Ghana
Ghana
-
 Greece
-
 Haiti
Haiti
-
 Hong Kong
-
 Hungary
-
 India
India
-
 Indonesia
-
 Iran, Islamic republic
-
 Iraq
Iraq
-
 Ireland
-
 Israel
-
 Italy
Italy
-
 Jamaica
-
 Japan
Japan
-
 Jordan
-
 Kazakhstan
-
 Kenya
Kenya
-
 Korea
Korea
-
 Kuwait
-
 Kyrgyzstan
-
 Laos
Laos
-
 Latvia
-
 Lebanon
-
 Lesotho
-
 Libya
Libya
-
 Lithuania
-
 Luxembourg
-
 Madagascar
-
 Malaysia
-
 Malta
Malta
-
 Mauritius
-
 Mexico
-
 Moldova
-
 Mongolia
-
 Montenegro
-
 Morocco
-
 Mozambique
-
 Myanmar
-
 Namibia
-
 Nepal
Nepal
-
 Netherlands
-
 New Zealand
-
 Nigeria
-
 North Macedonia
-
 Norway
-
 Oman
Oman
-
 Pakistan
-
 Palestine
-
 Panama
-
 Papua New Guinea
-
 Paraguay
-
 Peru
Peru
-
 Philippines
-
 Poland
-
 Portugal
-
 Puerto Rico
-
 Qatar
Qatar
-
 Reunion
-
 Romania
-
 Rwanda
-
 Saudi Arabia
-
 Serbia
-
 Singapore
-
 Slovakia
-
 Slovenia
-
 Somalia
-
 South Africa
-
 Spain
Spain
-
 Sri Lanka
-
 Sweden
-
 Switzerland
-
 Syria
Syria
-
 Taiwan
-
 Tajikistan
-
 Tanzania
-
 Thailand
-
 Trinidad and Tobago
-
 Tunisia
-
 Turkey
-
 UAE
UAE
-
 Uganda
-
 Ukraine
-
 United Kingdom
-
United States
-
 Uruguay
-
 Uzbekistan
-
 Venezuela
-
 Vietnam
-
 Yemen
Yemen
-
 Zambia
-
 Zimbabwe
- Forex
- Crypto
Live News
