

Aave: New strategic plan drives a 7.52% advance despite technical resistance

Aave (AAVE) is trading at $130.94, positioned above both the MA-20 ($126.15) and below the MA-50 ($148.09) and MA-200 ($220.79), which signals a short-term bullish bias but highlights ongoing medium- and long-term bearish pressure.
AAVE price prediction
Current price:
$110.31
4.37
4.12%
Real-time Data
06:51
Daily range
107.93
 110.35
Weekly range
96.60
132.51
132.51
Loading...
Highlights
- Aave Labs unveiled the 'Aave Will Win Framework' on February 12, 2026, proposing all protocol revenue be directed to the DAO treasury and establishing an Aave Foundation.
- The framework makes Aave V4 the new technical core and has prompted community debate on treasury funding size and transparency on previous fund use.
- AAVE is trading at $130.94, above the MA-20 ($126.15) but below MA-50 ($148.09), with near-term resistance at $148.09 and key support at $128.39.
Governance overhaul plan fuels debate over funding transparency
On February 12, 2026, Aave Labs introduced the 'Aave Will Win Framework,' a significant proposal aimed at restructuring the protocol’s economic model, governance, and product strategy for the next decade. The plan calls for moving 100% of revenue from all Aave products directly into the DAO treasury and would establish an Aave Foundation to oversee brand management, with Aave V4 targeted as the new technical core. This announcement has sparked notable community debate about funding size and transparency regarding previous fund usage.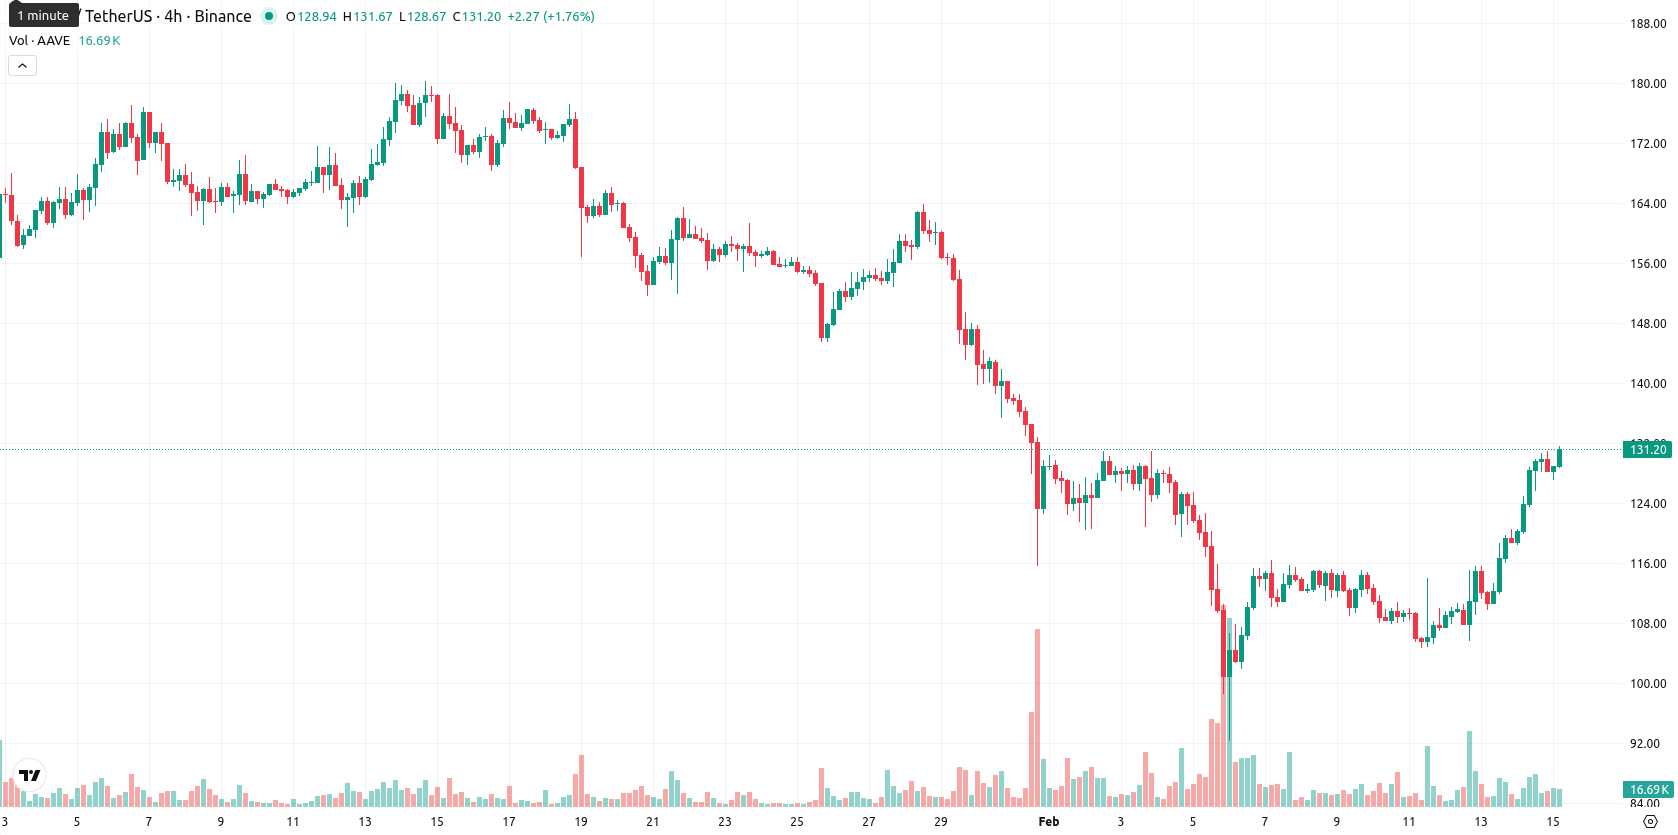
High volatility and buyer dominance amid mixed momentum signals
The closest dynamic support for AAVE is seen near the Ichimoku Kijun level at $128.39, with resistance at the MA-50 of $148.09. Momentum signals are mixed: while the daily MACD shows a strong bearish bias, the ADX favors sellers in a strong trend. The RSI is just below the midline at 48.28, signaling neutral momentum, while the Stochastic RSI and Bull/Bear Power indicate overbought intraday conditions and buyer dominance. The price is near the high of the day’s $127.13 – $131.55 range, and recent price action has included a notable gap up from $121.78 to $128.22, highlighting high volatility and persistent buying pressure in the short term.Sideways price outlook as rally chances remain subdued
In the near term, AAVE is expected to fluctuate between $129.00 and $134.00 over the next five sessions, reflecting typical volatility for this asset. The likelihood of a further rally is low (below 20%), so sideways action or a mild retreat remains more probable. Consolidation within this band remains the baseline scenario, while a move above $134.00 would require renewed momentum to break through resistance. If AAVE falls below $128.00, deeper declines could develop as mid- and long-term indicators continue to limit upside potential.
Viktoras Karapetjanc, expert at Traders Union, sees Aave trading in a volatile, constructive phase as short-term buyers maintain control above $128.00. He notes that major protocol reforms like the 'Aave Will Win Framework' are boosting long-term sentiment, but uncertainty around treasury management keeps some investors cautious. The analyst expects price action to remain capped below $134.00 unless new momentum materializes. Karapetjanc believes consolidation is the base scenario while fundamentals drive interest. "Aave’s new governance vision is encouraging for future growth, so I stay constructive as long as $128.00 holds."
Previously it was reported that Aave is trading below all major moving averages, reflecting persistent bearish momentum across multiple timeframes, with resistance aligned at the MA-20 and key governance levels. While daily momentum indicators such as MACD and ADX signal ongoing downside risk, short-term oscillators point to temporary buying exhaustion amid volatile conditions, suggesting possible range-bound price action unless a decisive technical breakout occurs.
Source of Data:
AAVE Price Analysis by TU
The analysis is based on a proprietary model combining technical, on-chain, and expert data. Not investment advice. See
methodology
The information is based on forecasts and does not constitute investment advice or a guarantee of future results. Market conditions may change. See our Disclaimer and Editorial Integrity for details.
Subscribe to TU news


Did you like the article?






Top News


Top 5 companies for you

United States
-
 Afghanistan
-
 Albania
-
 Algeria
-
 Angola
-
 Argentina
-
 Armenia
-
 Australia
-
 Austria
-
 Azerbaijan
-
 Bahamas
-
 Bahrain
-
 Bangladesh
-
 Belarus
-
 Belgium
-
 Bolivia
-
 Botswana
-
 Brazil
-
 Brunei
-
 Bulgaria
-
 Cambodia
-
 Cameroon
-
 Canada
-
 Chile
-
 China
-
 Colombia
-
 Congo
-
 Costa Rica
-
 Cote d'Ivoire
-
 Croatia
-
 Cuba
-
 Cyprus
-
 Czechia
-
 DR Congo
-
 Denmark
-
 Dominican Republic
-
 Ecuador
-
 Egypt
-
 El Salvador
-
 Estonia
-
 Eswatini
-
 Ethiopia
-
 Finland
-
 France
-
 Georgia
-
 Germany
-
 Ghana
-
 Greece
-
 Haiti
-
 Hong Kong
-
 Hungary
-
 India
-
 Indonesia
-
 Iran, Islamic republic
-
 Iraq
-
 Ireland
-
 Israel
-
 Italy
-
 Jamaica
-
 Japan
-
 Jordan
-
 Kazakhstan
-
 Kenya
-
 Korea
-
 Kuwait
-
 Kyrgyzstan
-
 Laos
-
 Latvia
-
 Lebanon
-
 Lesotho
-
 Libya
-
 Lithuania
-
 Luxembourg
-
 Madagascar
-
 Malaysia
-
 Malta
-
 Mauritius
-
 Mexico
-
 Moldova
-
 Mongolia
-
 Montenegro
-
 Morocco
-
 Mozambique
-
 Myanmar
-
 Namibia
-
 Nepal
-
 Netherlands
-
 New Zealand
-
 Nigeria
-
 North Macedonia
-
 Norway
-
 Oman
-
 Pakistan
-
 Palestine
-
 Panama
-
 Papua New Guinea
-
 Paraguay
-
 Peru
-
 Philippines
-
 Poland
-
 Portugal
-
 Puerto Rico
-
 Qatar
-
 Reunion
-
 Romania
-
 Rwanda
-
 Saudi Arabia
-
 Serbia
-
 Singapore
-
 Slovakia
-
 Slovenia
-
 Somalia
-
 South Africa
-
 Spain
-
 Sri Lanka
-
 Sweden
-
 Switzerland
-
 Syria
-
 Taiwan
-
 Tajikistan
-
 Tanzania
-
 Thailand
-
 Trinidad and Tobago
-
 Tunisia
-
 Turkey
-
 UAE
-
 Uganda
-
 Ukraine
-
 United Kingdom
-
United States
-
 Uruguay
-
 Uzbekistan
-
 Venezuela
-
 Vietnam
-
 Yemen
-
 Zambia
-
 Zimbabwe
- Forex
- Crypto










Live News


