
HBAR holds steady within volatile $0.0900–$0.1050 trading corridor amid neutral RSI and ongoing seller pressure – weekly forecast

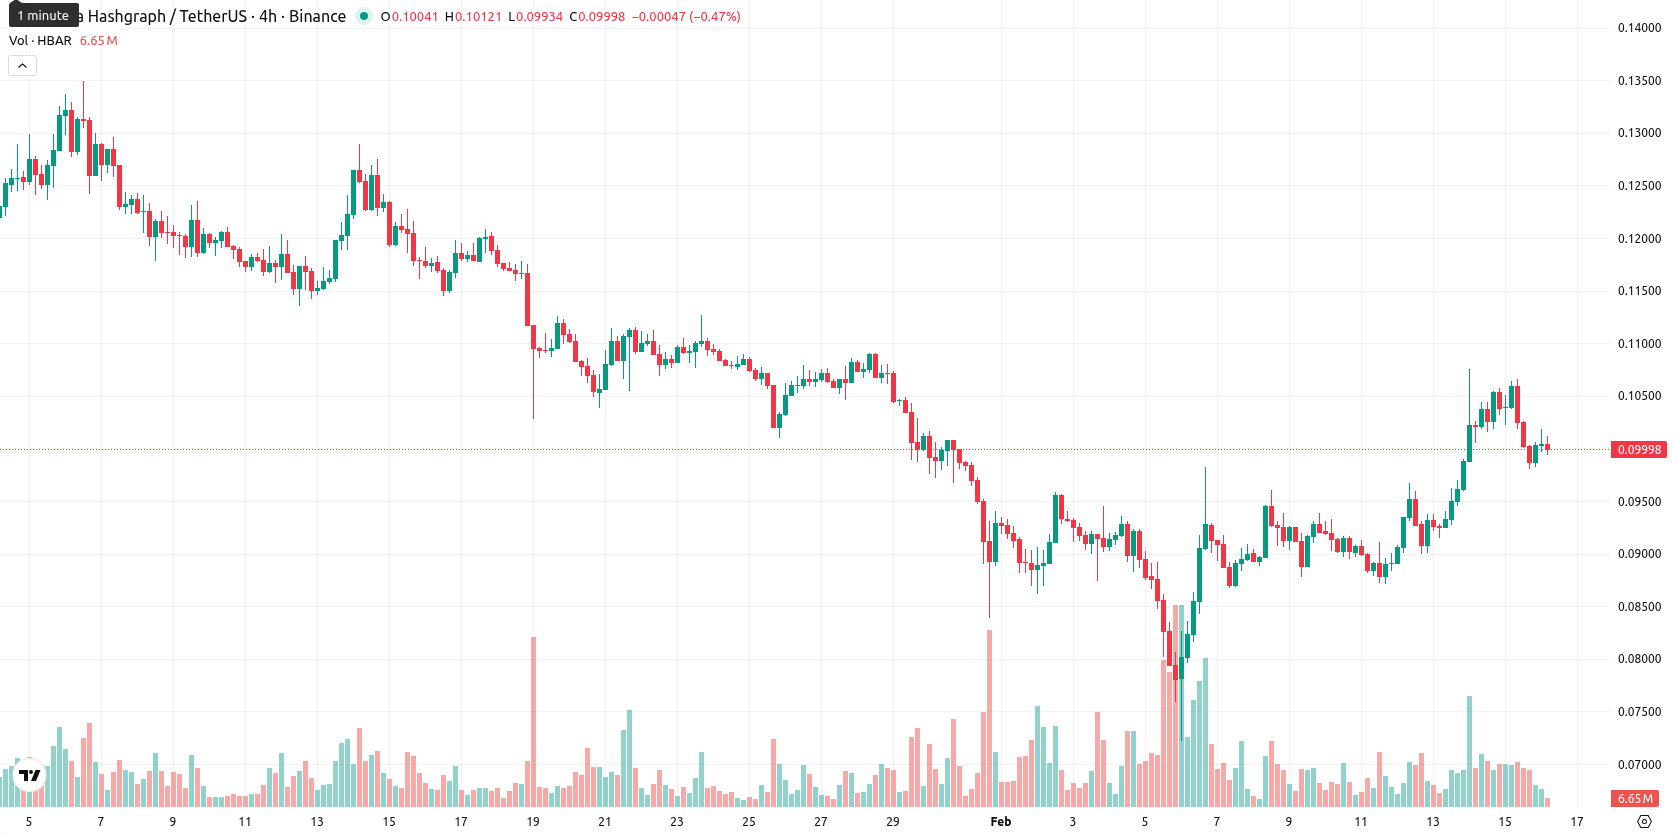
Hedera (HBAR) is currently valued at $0.0998, marking a move just above its weekly MA-20 ($0.0944) but remaining below the MA-50 ($0.1074) and MA-200 ($0.1702). Over the past week, HBAR experienced a moderate drawdown, with the price down 5.18%, reflecting near-term strength but ongoing pressure from medium- and long-term sellers as it navigates between dynamic support and resistance levels on the weekly chart.
Highlights
- HBAR trades at $0.0998, above the MA-20 ($0.0944) but below MA-50 ($0.1074) and MA-200 ($0.1702), showing short-term strength amid broader selling pressures.
- Momentum indicators are mixed: MACD signals strong sell, ADX shows weak trends, RSI reads 51 (neutral/slightly bullish), while Stochastic RSI warns of overbought conditions.
- For the next five days, HBAR is likely to remain range-bound between $0.0900–$0.1050, with key resistance at $0.1074 and support at $0.0924.
Corporate partnership and DeFi outflows influence sentiment and trading this week
FedEx has joined the Hedera Governance Council, operating a node and participating in platform governance. This corporate partnership aims to use Hedera's distributed ledger technology to digitalize global supply chains and has contributed to a rise in trading activity. Meanwhile, declines in DeFi total value locked, reduced dApp revenue, stagnant ETF inflows, and Hedera’s integration of the x402 micropayment standard have also shaped recent ecosystem developments.
Neutral momentum dominates as HBAR stalls below resistance during the week
On the weekly timeframe, HBAR trades above the MA-20 ($0.0944) but below key resistance at the MA-50 ($0.1074) and the longer-term MA-200 ($0.1702). Immediate dynamic support is established by the Ichimoku Kijun at $0.0924, while the primary resistance remains at $0.1074. The weekly RSI stands at 51, indicating a neutral to mildly bullish stance, though the overall trend remains subdued. Weekly volatility has increased, and sellers continue to dominate medium- and long-term momentum, as reinforced by still-weak trend indicators.
Rangebound outlook expected as volatility rises for the coming week
Over the next five to seven trading days, HBAR is likely to oscillate between $0.0900 and $0.1050, reflecting ongoing uncertainty and increased volatility. Most technical signals support a baseline scenario of sideways movement within this range, with a low probability of a sustained breakout. A bullish scenario would require a decisive close above $0.1074, opening the path to higher levels, while a slip under $0.0924 support could expose HBAR to further downside. Ultimately, price action is expected to remain contained in the identified corridor barring a significant shift in weekly momentum.
Last time, analysts noted that HBAR is exhibiting short-term bullish momentum above its 20-day moving average and Ichimoku Kijun, yet remains below medium- and long-term moving averages, underscoring continued overall downtrend resistance. Mixed momentum signals—including a bearish MACD, prevailing downtrend on ADX, overbought Stoch RSI, and neutral RSI—suggest the recent upward move may be capped, with price likely to consolidate near current support and resistance levels.


-
 Afghanistan
-
 Albania
-
 Algeria
-
 Angola
-
 Argentina
-
 Armenia
-
 Australia
-
 Austria
-
 Azerbaijan
-
 Bahamas
-
 Bahrain
-
 Bangladesh
-
 Belarus
-
 Belgium
-
 Bolivia
-
 Botswana
-
 Brazil
-
 Brunei
-
 Bulgaria
-
 Cambodia
-
 Cameroon
-
 Canada
-
 Chile
Chile
-
 China
China
-
 Colombia
-
 Congo
Congo
-
 Costa Rica
-
 Cote d'Ivoire
-
 Croatia
-
 Cuba
Cuba
-
 Cyprus
-
 Czechia
-
 DR Congo
-
 Denmark
-
 Dominican Republic
-
 Ecuador
-
 Egypt
Egypt
-
 El Salvador
-
 Estonia
-
 Eswatini
-
 Ethiopia
-
 Finland
-
 France
-
 Georgia
-
 Germany
-
 Ghana
Ghana
-
 Greece
-
 Haiti
Haiti
-
 Hong Kong
-
 Hungary
-
 India
India
-
 Indonesia
-
 Iran, Islamic republic
-
 Iraq
Iraq
-
 Ireland
-
 Israel
-
 Italy
Italy
-
 Jamaica
-
 Japan
Japan
-
 Jordan
-
 Kazakhstan
-
 Kenya
Kenya
-
 Korea
Korea
-
 Kuwait
-
 Kyrgyzstan
-
 Laos
Laos
-
 Latvia
-
 Lebanon
-
 Lesotho
-
 Libya
Libya
-
 Lithuania
-
 Luxembourg
-
 Madagascar
-
 Malaysia
-
 Malta
Malta
-
 Mauritius
-
 Mexico
-
 Moldova
-
 Mongolia
-
 Montenegro
-
 Morocco
-
 Mozambique
-
 Myanmar
-
 Namibia
-
 Nepal
Nepal
-
 Netherlands
-
 New Zealand
-
 Nigeria
-
 North Macedonia
-
 Norway
-
 Oman
Oman
-
 Pakistan
-
 Palestine
-
 Panama
-
 Papua New Guinea
-
 Paraguay
-
 Peru
Peru
-
 Philippines
-
 Poland
-
 Portugal
-
 Puerto Rico
-
 Qatar
Qatar
-
 Reunion
-
 Romania
-
 Rwanda
-
 Saudi Arabia
-
 Serbia
-
 Singapore
-
 Slovakia
-
 Slovenia
-
 Somalia
-
 South Africa
-
 Spain
Spain
-
 Sri Lanka
-
 Sweden
-
 Switzerland
-
 Syria
Syria
-
 Taiwan
-
 Tajikistan
-
 Tanzania
-
 Thailand
-
 Trinidad and Tobago
-
 Tunisia
-
 Turkey
-
 UAE
UAE
-
 Uganda
-
 Ukraine
-
 United Kingdom
-
United States
-
 Uruguay
-
 Uzbekistan
-
 Venezuela
-
 Vietnam
-
 Yemen
Yemen
-
 Zambia
-
 Zimbabwe
- Forex
- Crypto
