
Hedera price prediction: Will network stagnation persist as HBAR tests $0.0735–$0.0913 range?

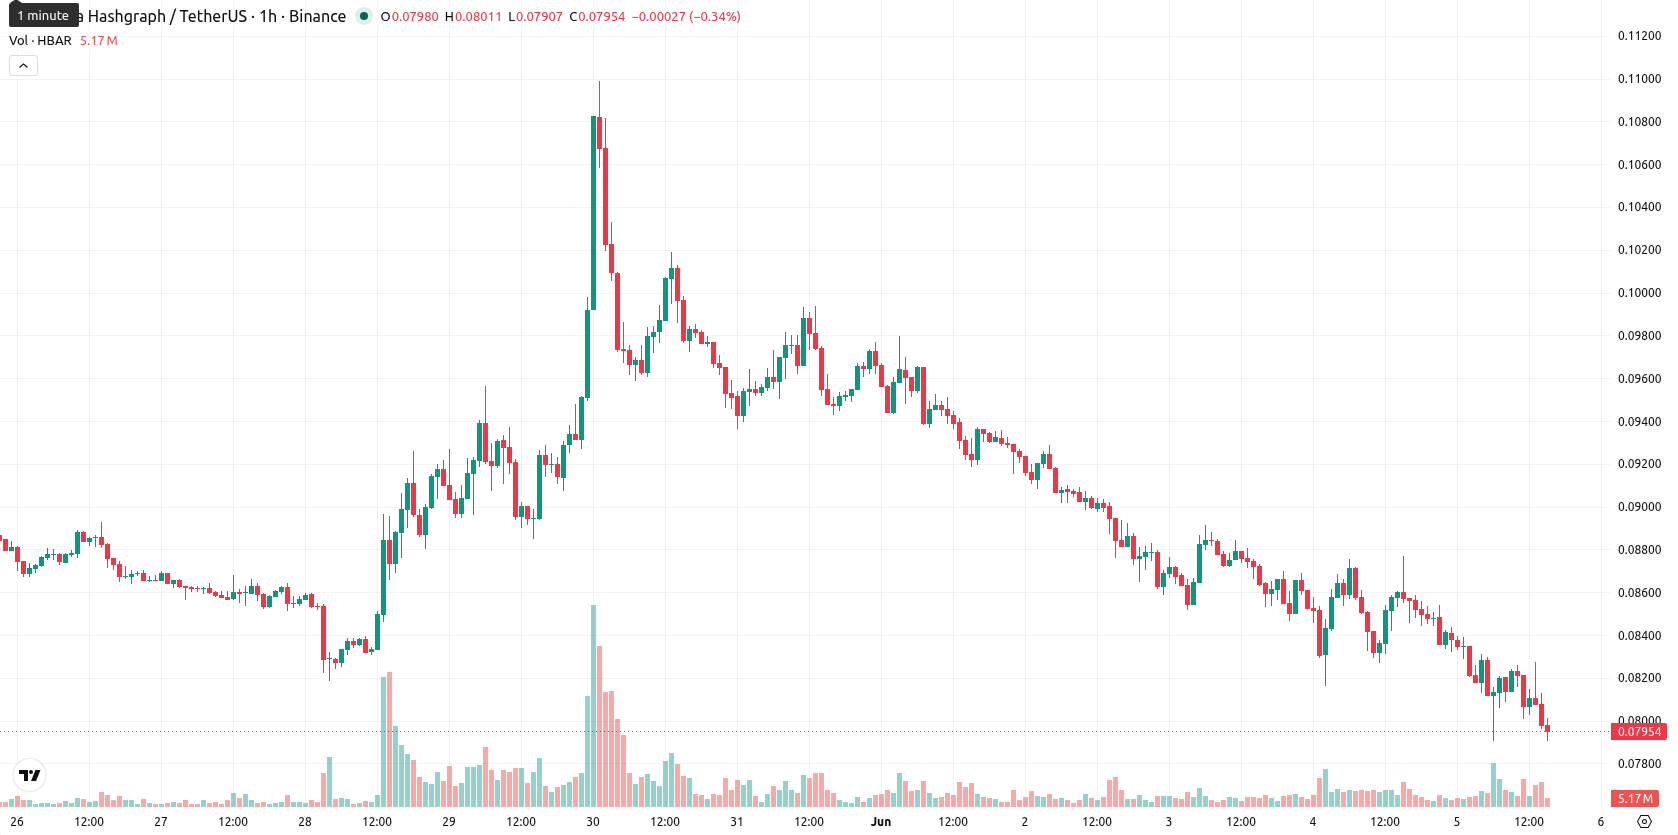
Hedera (HBAR) is trading at $0.0798, declining 8.39% over the last 24 hours. The asset currently remains below its key moving averages, reflecting continued downward momentum in recent sessions.
 0.0684
0.0745
0.0684
0.0745
Highlights
- Hedera is expanding institutional network utility with new enterprise partnerships across supply chain, stablecoin, and carbon market applications.
- The network’s council, featuring leading corporations like Google and IBM, supports Hedera’s credibility for enterprise adoption despite ongoing participation challenges.
- HBAR/USD trades below key averages with strong bearish momentum, high volatility, and a likely short-term range of $0.0735 to $0.0913.
Institutional partnerships drive utility as growth lags on-chain activity
Hedera has been building enterprise partnerships across supply chain, stablecoin, and carbon markets, as reported by TechBullion, introducing new applications that could expand network utility for institutional clients. The governance model, involving a council of major global corporations such as Google, IBM, and LG, continues to lend credibility for potential corporate adoption, according to the same source. Separately, Benzinga has noted ongoing challenges around driving higher on-chain volume and increasing participation among users and enterprises, providing a counterpoint on activity and growth — though price action has remained under broader selling pressure.
Bearish signals persist amid aggressive downside and mixed indicators
Technically, HBAR/USD is trading below the MA-20 at $0.0824, MA-50 at $0.0843, and MA-200 at $0.1037, indicating persistent bearishness across timeframes. The Ichimoku Kijun line is positioned at $0.0834, serving as immediate resistance. Momentum indicators show MACD and ADX in sell mode, while the RSI is at 33.76 and CCI is oversold. Stoch RSI is neutral, and both BBP and Awesome Oscillator indicate mixed signals, with sellers dominating intraday and high volatility near session lows. Divergence is apparent as downside momentum remains aggressive while some oscillators show balance.
Sideways risk dominates as upside reversal remains unlikely
In the short term, HBAR is likely to fluctuate within the $0.0735 to $0.0913 volatility band relative to current levels. The baseline scenario favors sideways movement between these support and resistance levels. A break above immediate resistance would open the way for a bullish scenario, while a breach below support could trigger further downside acceleration. The likelihood of an upward reversal is considered low based on recent price action and current technical signals.
Previously it was reported that Hedera exhibited entrenched bearish momentum, with technical indicators pointing to a sustained negative trend despite growing enterprise partnerships. The current article reinforces this outlook, as ongoing downside pressure and weak reversal signals suggest that monitoring for a decisive move outside the $0.0735–$0.0913 volatility band will be critical for identifying the next directional shift.








-
 Afghanistan
-
 Albania
-
 Algeria
-
 Angola
-
 Argentina
-
 Armenia
-
 Australia
-
 Austria
-
 Azerbaijan
-
 Bahamas
-
 Bahrain
-
 Bangladesh
-
 Belarus
-
 Belgium
-
 Bolivia
-
 Botswana
-
 Brazil
-
 Brunei
-
 Bulgaria
-
 Cambodia
-
 Cameroon
-
 Canada
-
 Chile
Chile
-
 China
China
-
 Colombia
-
 Congo
Congo
-
 Costa Rica
-
 Cote d'Ivoire
-
 Croatia
-
 Cuba
Cuba
-
 Cyprus
-
 Czechia
-
 DR Congo
-
 Denmark
-
 Dominican Republic
-
 Ecuador
-
 Egypt
Egypt
-
 El Salvador
-
 Estonia
-
 Eswatini
-
 Ethiopia
-
 Finland
-
 France
-
 Georgia
-
 Germany
-
 Ghana
Ghana
-
 Greece
-
 Haiti
Haiti
-
 Hong Kong
-
 Hungary
-
 India
India
-
 Indonesia
-
 Iran, Islamic republic
-
 Iraq
Iraq
-
 Ireland
-
 Israel
-
 Italy
Italy
-
 Jamaica
-
 Japan
Japan
-
 Jordan
-
 Kazakhstan
-
 Kenya
Kenya
-
 Korea
Korea
-
 Kuwait
-
 Kyrgyzstan
-
 Laos
Laos
-
 Latvia
-
 Lebanon
-
 Lesotho
-
 Libya
Libya
-
 Lithuania
-
 Luxembourg
-
 Madagascar
-
 Malaysia
-
 Malta
Malta
-
 Mauritius
-
 Mexico
-
 Moldova
-
 Mongolia
-
 Montenegro
-
 Morocco
-
 Mozambique
-
 Myanmar
-
 Namibia
-
 Nepal
Nepal
-
 Netherlands
-
 New Zealand
-
 Nigeria
-
 North Macedonia
-
 Norway
-
 Oman
Oman
-
 Pakistan
-
 Palestine
-
 Panama
-
 Papua New Guinea
-
 Paraguay
-
 Peru
Peru
-
 Philippines
-
 Poland
-
 Portugal
-
 Puerto Rico
-
 Qatar
Qatar
-
 Reunion
-
 Romania
-
 Rwanda
-
 Saudi Arabia
-
 Serbia
-
 Singapore
-
 Slovakia
-
 Slovenia
-
 Somalia
-
 South Africa
-
 Spain
Spain
-
 Sri Lanka
-
 Sweden
-
 Switzerland
-
 Syria
Syria
-
 Taiwan
-
 Tajikistan
-
 Tanzania
-
 Thailand
-
 Trinidad and Tobago
-
 Tunisia
-
 Turkey
-
 UAE
UAE
-
 Uganda
-
 Ukraine
-
 United Kingdom
-
United States
-
 Uruguay
-
 Uzbekistan
-
 Venezuela
-
 Vietnam
-
 Yemen
Yemen
-
 Zambia
-
 Zimbabwe
- Forex
- Crypto












