

Hedera weakens amid oversold RSI conditions and seller dominance: weekly report

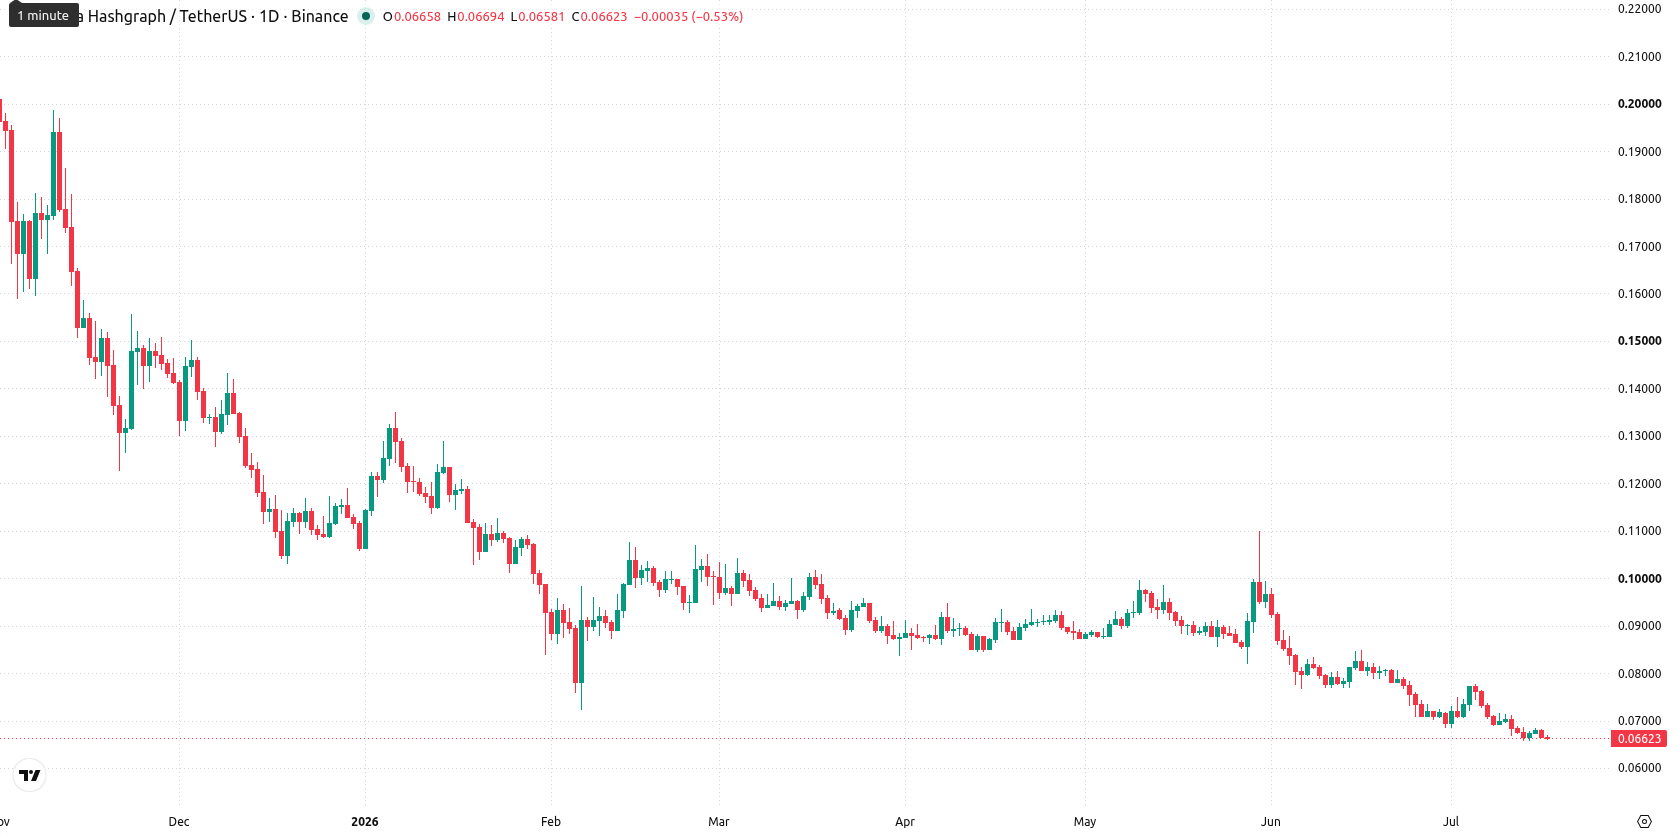
Hedera (HBAR) is trading at $0.0662, down $0.0043 (6.05%) over the past week, and sits at the very bottom of its weekly range. HBAR remains well below its MA-20 ($0.0852), MA-50 ($0.1312), and MA-200 ($0.1109) on the W1 chart, signaling persistent medium- and long-term bearish pressure.
 0.087
0.0999
0.087
0.0999
Highlights
- HBAR remains in a strong medium- and long-term downtrend, trading well below major moving average resistance levels.
- Momentum and oscillators indicate persistent oversold conditions, with consistent selling pressure dominating across all technical signals.
- Expected seven-day price range is $0.061 to $0.072, with limited rebound probability and further downside risk if $0.061 breaks.
DeFi exploit and enterprise milestones reshape HBAR sentiment this week
HBAR was impacted by a $9.05 million oracle exploit on the Bonzo Lend protocol, which led to a sharp drop in Hedera's total value locked and highlighted security concerns for DeFi integrations, though Hedera's core infrastructure was unaffected. In the same period, Hedera saw increased enterprise activity, with Lloyds Banking Group, Aberdeen Investments, and Archax executing the UK's first foreign exchange transaction involving tokenized real-world assets on its network, as noted in an official HM Treasury report. Hedera also integrated institutional custody provider Utila and deepened its partnership with Taurus, bringing more regulated custody and smart contract access to institutional clients.
Bearish momentum entrenched as all major indicators flash oversold
Weekly technical signals remain firmly bearish for HBAR, with the price below all major moving averages and the MA-20 acting as the nearest resistance. The Ichimoku Kijun level and downward trending moving averages add to the negative outlook. Weekly indicators confirm bearish momentum: MACD signals a strong sell, ADX stands at 19.8 (weak trend), RSI is oversold at 33.1, CCI at -176.9, and the Stochastic RSI also deep in oversold territory. Seller dominance is reinforced by negative Bull/Bear Power and the Awesome Oscillator, while weekly volatility reached 8.54%.
Limited rebound chances as technicals favor continued range-bound decline next week
Over the next 7 days, HBAR is expected to trade within a range of $0.061 to $0.072, reflecting normal weekly volatility. With no buy signals from major W1 indicators and a persistent bearish tone, a further decline or sideways move in this range remains the baseline scenario. The probability of a meaningful rebound is very low (under 20%). A bullish scenario would require a breakout above $0.072, while a drop under $0.061 could expose HBAR to new yearly lows.
Earlier, analysts highlighted Hedera's entrenched bearish trend, with technical indicators overwhelmingly favoring sellers. The current week reinforces this negative outlook amid new security challenges and persistent technical weakness, making a breakout above $0.072 the pivotal threshold to monitor for any potential shift in momentum.










-
 Afghanistan
-
 Albania
-
 Algeria
-
 Angola
-
 Argentina
-
 Armenia
-
 Australia
-
 Austria
-
 Azerbaijan
-
 Bahamas
-
 Bahrain
-
 Bangladesh
-
 Belarus
-
 Belgium
-
 Bolivia
-
 Botswana
-
 Brazil
-
 Brunei
-
 Bulgaria
-
 Cambodia
-
 Cameroon
-
 Canada
-
 Chile
Chile
-
 China
China
-
 Colombia
-
 Congo
Congo
-
 Costa Rica
-
 Cote d'Ivoire
-
 Croatia
-
 Cuba
Cuba
-
 Cyprus
-
 Czechia
-
 DR Congo
-
 Denmark
-
 Dominican Republic
-
 Ecuador
-
 Egypt
Egypt
-
 El Salvador
-
 Estonia
-
 Eswatini
-
 Ethiopia
-
 Finland
-
 France
-
 Georgia
-
 Germany
-
 Ghana
Ghana
-
 Greece
-
 Haiti
Haiti
-
 Hong Kong
-
 Hungary
-
 India
India
-
 Indonesia
-
 Iran, Islamic republic
-
 Iraq
Iraq
-
 Ireland
-
 Israel
-
 Italy
Italy
-
 Jamaica
-
 Japan
Japan
-
 Jordan
-
 Kazakhstan
-
 Kenya
Kenya
-
 Korea
Korea
-
 Kuwait
-
 Kyrgyzstan
-
 Laos
Laos
-
 Latvia
-
 Lebanon
-
 Lesotho
-
 Libya
Libya
-
 Lithuania
-
 Luxembourg
-
 Madagascar
-
 Malaysia
-
 Malta
Malta
-
 Mauritius
-
 Mexico
-
 Moldova
-
 Mongolia
-
 Montenegro
-
 Morocco
-
 Mozambique
-
 Myanmar
-
 Namibia
-
 Nepal
Nepal
-
 Netherlands
-
 New Zealand
-
 Nigeria
-
 North Macedonia
-
 Norway
-
 Oman
Oman
-
 Pakistan
-
 Palestine
-
 Panama
-
 Papua New Guinea
-
 Paraguay
-
 Peru
Peru
-
 Philippines
-
 Poland
-
 Portugal
-
 Puerto Rico
-
 Qatar
Qatar
-
 Reunion
-
 Romania
-
 Rwanda
-
 Saudi Arabia
-
 Serbia
-
 Singapore
-
 Slovakia
-
 Slovenia
-
 Somalia
-
 South Africa
-
 Spain
Spain
-
 Sri Lanka
-
 Sweden
-
 Switzerland
-
 Syria
Syria
-
 Taiwan
-
 Tajikistan
-
 Tanzania
-
 Thailand
-
 Trinidad and Tobago
-
 Tunisia
-
 Turkey
-
 UAE
UAE
-
 Uganda
-
 Ukraine
-
 United Kingdom
-
United States
-
 Uruguay
-
 Uzbekistan
-
 Venezuela
-
 Vietnam
-
 Yemen
Yemen
-
 Zambia
-
 Zimbabwe
- Forex
- Crypto












