
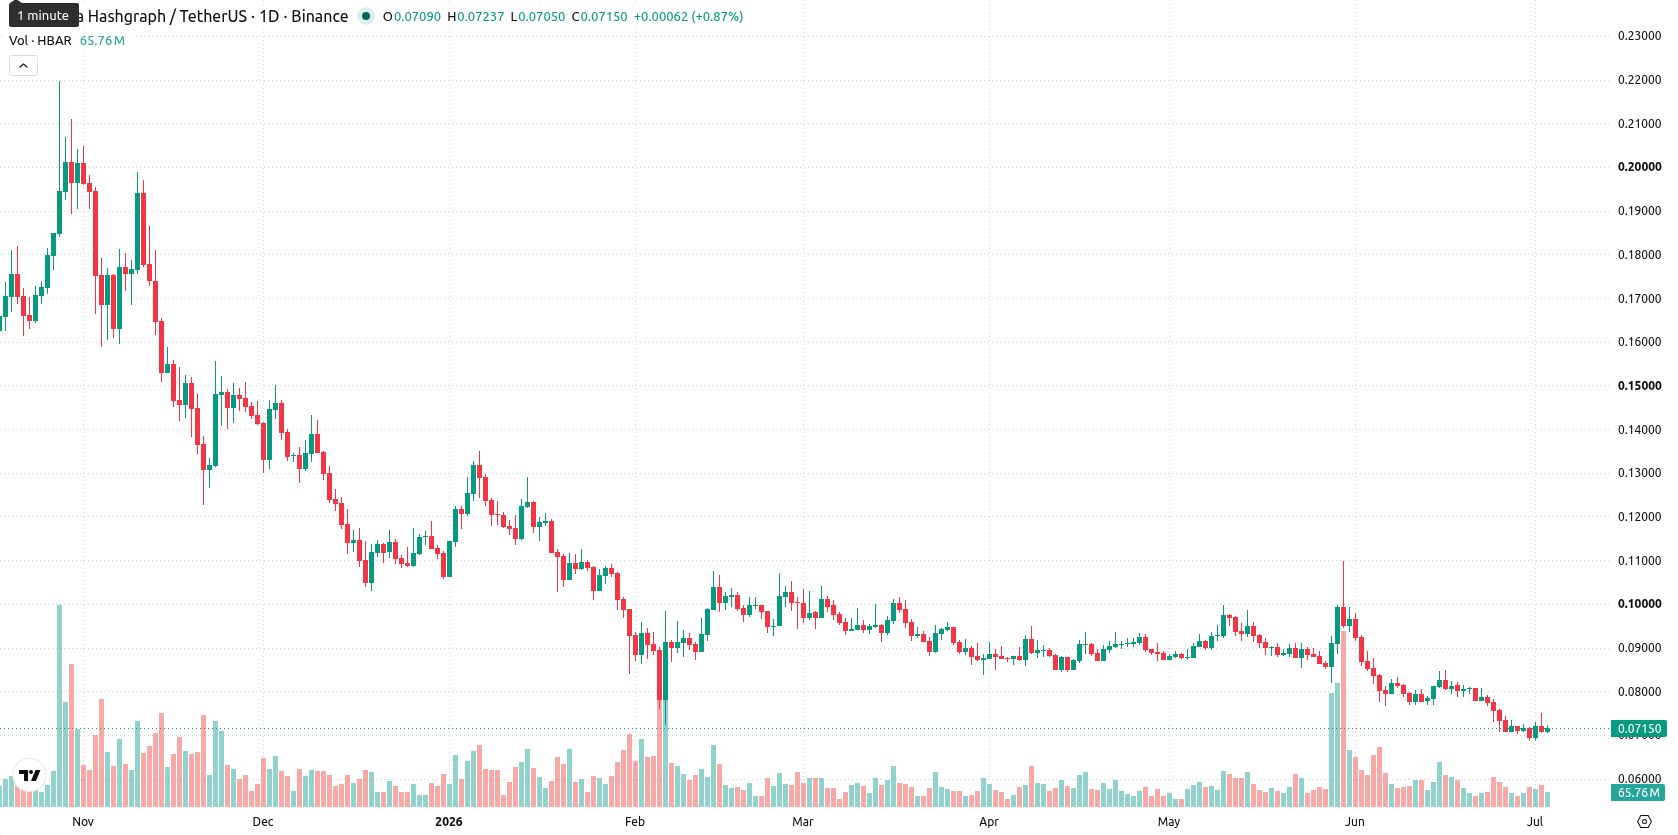
Hedera ticks up as volatility stays elevated with resistance seen above $0.0810: weekly review

Hedera (HBAR) is currently trading at $0.0741, which is well below the weekly MA-20 at $0.0879, MA-50 at $0.1392, and MA-200 at $0.1108. Over the last week, HBAR edged up by $0.0008 (slipping 2.41%) and now sits at the very top of its weekly range, reflecting a mild recovery amid persistent bearish pressure from sellers.
Highlights
- HBAR is trading well below key moving averages, indicating sustained bearish momentum and lack of dynamic support.
- Sell signals dominate across momentum and trend indicators, with deeply oversold readings and negligible buying activity.
- HBAR is likely to move sideways within $0.0672–$0.0810; further declines are possible if support fails.
Institutional adoption accelerates as regulatory clarity boosts sentiment
Hedera recently facilitated the settlement of tokenized assets, including UK gilts and BlackRock money market funds, on its network, with Lloyds Banking Group utilizing Hedera for FX collateral transactions. Its enterprise-grade governance model has enabled over $10 billion in real-world asset settlements and continues to attract notable institutional partners such as Google, IBM, Boeing, FedEx, and Nvidia. Regulatory clarity has advanced, as both the SEC and CFTC classified HBAR as a digital commodity in 2026, with new compliance standards like MiCA and US stablecoin legislation benefitting the network. Hedera's ongoing status as a carbon-negative proof-of-stake platform further supports its profile among institutional users.
Bearish momentum prevails over the week as indicators stay oversold
On the weekly (W1) timeframe, HBAR trades well below all major moving averages — MA-20, MA-50, and MA-200 — with no dynamic support in sight. Weekly momentum indicators such as MACD and ADX continue signaling strong sell conditions, while oscillators depict deeply oversold territory: RSI stands at 32.7, Stochastic RSI at 6, and CCI at -199. Both Bull Power and Bear Power confirm dominant selling pressure, and weekly volatility remains elevated at 9.34%. HBAR closed the week at the upper edge of its range, yet stays locked in a bearish, volatile pattern with distant resistance above.
Sideways bias likely amid weak buying signals and elevated volatility
In the next 7 days, HBAR is expected to trade between $0.0672 and $0.0810, reflecting ongoing volatility and a lack of bullish momentum on the weekly chart. None of the four key weekly indicators currently signal a Buy or Strong Buy, resulting in less than a 20% probability of upward movement. The most likely scenario is continued sideways action as the market digests prior declines, though a sustained break above $0.0810 could open the door for recovery. Conversely, failure to hold $0.0672 would reinforce the downtrend and set up for further losses.
Earlier, analysts noted that Hedera was exhibiting a cautiously constructive technical outlook amid organizational growth and improving short-term momentum. The current analysis, however, reflects a marked shift to persistent bearish conditions on the weekly timeframe, signaling that traders should closely monitor the $0.0672 support, as a breakdown below this level could intensify downside risk in the near term.


-
 Afghanistan
-
 Albania
-
 Algeria
-
 Angola
-
 Argentina
-
 Armenia
-
 Australia
-
 Austria
-
 Azerbaijan
-
 Bahamas
-
 Bahrain
-
 Bangladesh
-
 Belarus
-
 Belgium
-
 Bolivia
-
 Botswana
-
 Brazil
-
 Brunei
-
 Bulgaria
-
 Cambodia
-
 Cameroon
-
 Canada
-
 Chile
Chile
-
 China
China
-
 Colombia
-
 Congo
Congo
-
 Costa Rica
-
 Cote d'Ivoire
-
 Croatia
-
 Cuba
Cuba
-
 Cyprus
-
 Czechia
-
 DR Congo
-
 Denmark
-
 Dominican Republic
-
 Ecuador
-
 Egypt
Egypt
-
 El Salvador
-
 Estonia
-
 Eswatini
-
 Ethiopia
-
 Finland
-
 France
-
 Georgia
-
 Germany
-
 Ghana
Ghana
-
 Greece
-
 Haiti
Haiti
-
 Hong Kong
-
 Hungary
-
 India
India
-
 Indonesia
-
 Iran, Islamic republic
-
 Iraq
Iraq
-
 Ireland
-
 Israel
-
 Italy
Italy
-
 Jamaica
-
 Japan
Japan
-
 Jordan
-
 Kazakhstan
-
 Kenya
Kenya
-
 Korea
Korea
-
 Kuwait
-
 Kyrgyzstan
-
 Laos
Laos
-
 Latvia
-
 Lebanon
-
 Lesotho
-
 Libya
Libya
-
 Lithuania
-
 Luxembourg
-
 Madagascar
-
 Malaysia
-
 Malta
Malta
-
 Mauritius
-
 Mexico
-
 Moldova
-
 Mongolia
-
 Montenegro
-
 Morocco
-
 Mozambique
-
 Myanmar
-
 Namibia
-
 Nepal
Nepal
-
 Netherlands
-
 New Zealand
-
 Nigeria
-
 North Macedonia
-
 Norway
-
 Oman
Oman
-
 Pakistan
-
 Palestine
-
 Panama
-
 Papua New Guinea
-
 Paraguay
-
 Peru
Peru
-
 Philippines
-
 Poland
-
 Portugal
-
 Puerto Rico
-
 Qatar
Qatar
-
 Reunion
-
 Romania
-
 Rwanda
-
 Saudi Arabia
-
 Serbia
-
 Singapore
-
 Slovakia
-
 Slovenia
-
 Somalia
-
 South Africa
-
 Spain
Spain
-
 Sri Lanka
-
 Sweden
-
 Switzerland
-
 Syria
Syria
-
 Taiwan
-
 Tajikistan
-
 Tanzania
-
 Thailand
-
 Trinidad and Tobago
-
 Tunisia
-
 Turkey
-
 UAE
UAE
-
 Uganda
-
 Ukraine
-
 United Kingdom
-
United States
-
 Uruguay
-
 Uzbekistan
-
 Venezuela
-
 Vietnam
-
 Yemen
Yemen
-
 Zambia
-
 Zimbabwe
- Forex
- Crypto
