

Utila integration expands institutional access: Can HBAR clear $0.0911 resistance?

Hedera (HBAR) is trading at $0.0735, having risen 7.25% on the day. The asset currently sits above its key short- and medium-term moving averages, supported by strong intraday momentum.
 0.087
0.0999
0.087
0.0999
Highlights
- Hedera’s partnership with Utila is set to streamline institutional onboarding, potentially accelerating network adoption and enterprise demand.
- Canary’s spot Hedera ETF attracted $540,000 in net inflows on July 20, now holding nearly 1.6% of HBAR's circulating supply.
- HBAR trades with strong bullish momentum and buying signals, but overbought conditions increase risk of a short-term pullback within the $0.0722–$0.0748 range.
Institutional demand grows as Utila partnership and ETF inflows align
Hedera’s newly announced partnership with Utila, an institutional-grade digital asset custody and wallet provider, represents a significant step in expanding access for enterprise and professional market participants. This integration is expected to stimulate demand by simplifying onboarding processes and enhancing institutional utility, directly supporting broader adoption of Hedera’s network. Meanwhile, according to Tradingview, Canary’s spot Hedera ETF continues to attract substantial inflows, recording a $540,000 net addition on July 20 and now holding close to 1.6% of circulating supply, which signals sustained institutional accumulation. Underlying these developments, rapid growth in daily active wallets and decentralized application transaction volumes further strengthens the token’s fundamental demand profile.
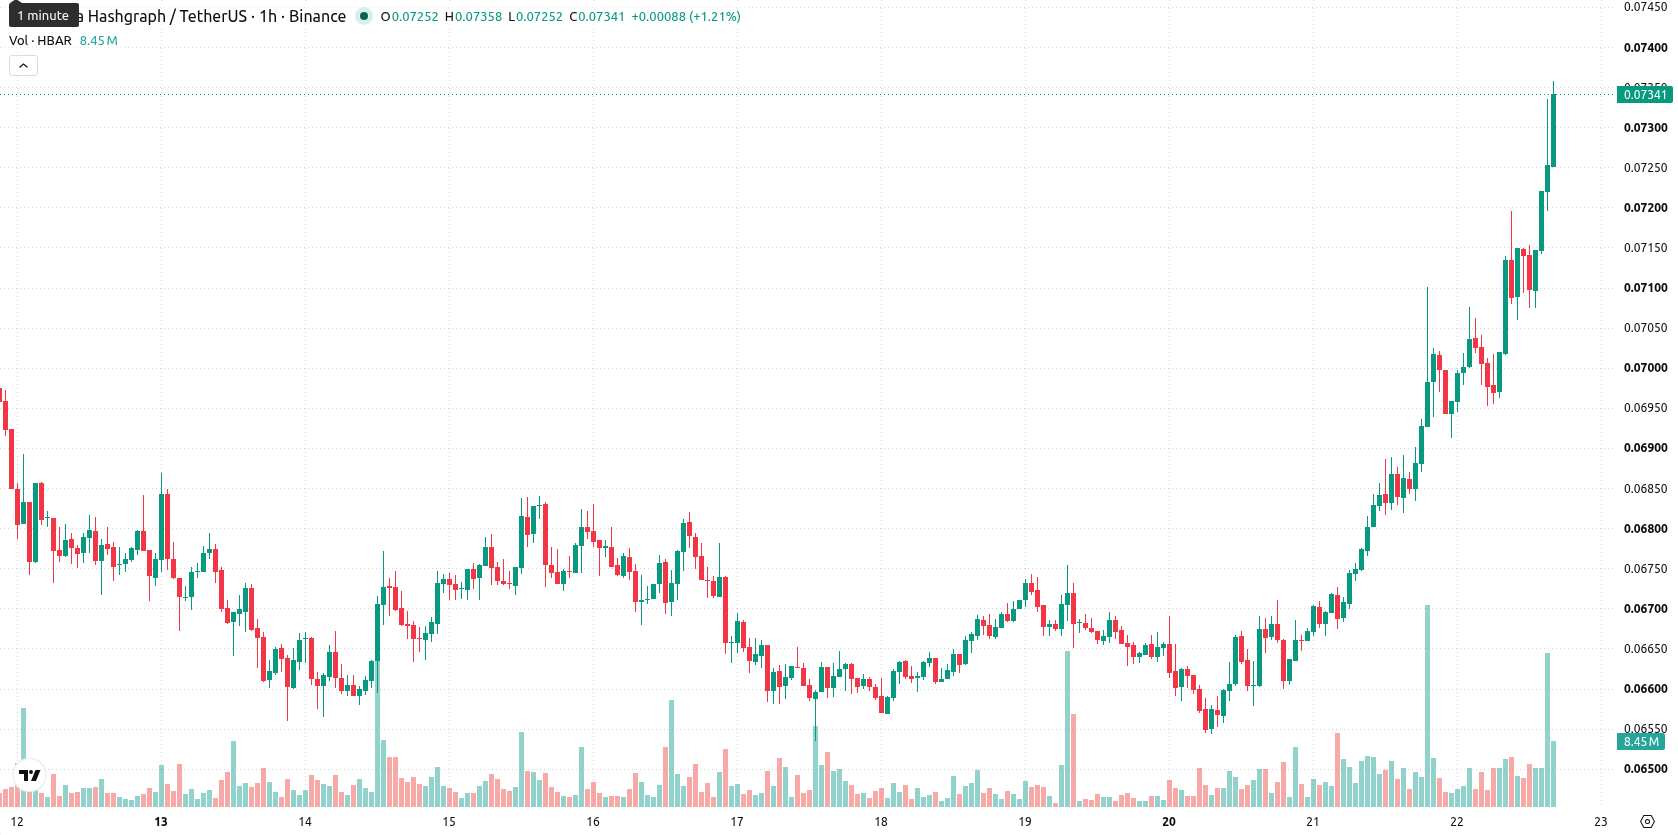
Momentum strong but overbought signals emerge as resistance looms
Technically, HBAR/USD is positioned above the MA-20 at $0.0706 and the MA-50 at $0.0687, yet remains below the longer-term MA-200 at $0.0911. Immediate support is marked by the Ichimoku Kijun at $0.0708. On the intraday chart, both MACD and ADX are generating Buy signals, while RSI has reached 73.34 and CCI, along with Stochastic RSI, all indicate overbought conditions. Bull/Bear Power points to buyer dominance, whereas the Awesome Oscillator stays neutral, not contradicting the prevailing momentum. This blend of signals reveals strong bullish momentum but rising risks of short-term overextension.
Range-bound outlook holds as breakout and support levels guide risk
Over the next 2-3 trading days, HBAR is expected to fluctuate within a range of $0.0722 to $0.0748, reflecting typical volatility at current levels. The baseline forecast envisions price consolidation within this corridor. A clear breakout above the upper boundary could trigger further gains, while a drop below the $0.0708 Kijun support would shift the scenario to short-term downside risk.
Earlier, analysts noted that Hedera was entrenched in a persistent bearish trend driven by weak technicals and security concerns. The recent shift to bullish short-term momentum, coupled with expanding institutional activity, now positions a decisive breakout above $0.0748 as the catalyst for a sustained upside move.










-
 Afghanistan
-
 Albania
-
 Algeria
-
 Angola
-
 Argentina
-
 Armenia
-
 Australia
-
 Austria
-
 Azerbaijan
-
 Bahamas
-
 Bahrain
-
 Bangladesh
-
 Belarus
-
 Belgium
-
 Bolivia
-
 Botswana
-
 Brazil
-
 Brunei
-
 Bulgaria
-
 Cambodia
-
 Cameroon
-
 Canada
-
 Chile
Chile
-
 China
China
-
 Colombia
-
 Congo
Congo
-
 Costa Rica
-
 Cote d'Ivoire
-
 Croatia
-
 Cuba
Cuba
-
 Cyprus
-
 Czechia
-
 DR Congo
-
 Denmark
-
 Dominican Republic
-
 Ecuador
-
 Egypt
Egypt
-
 El Salvador
-
 Estonia
-
 Eswatini
-
 Ethiopia
-
 Finland
-
 France
-
 Georgia
-
 Germany
-
 Ghana
Ghana
-
 Greece
-
 Haiti
Haiti
-
 Hong Kong
-
 Hungary
-
 India
India
-
 Indonesia
-
 Iran, Islamic republic
-
 Iraq
Iraq
-
 Ireland
-
 Israel
-
 Italy
Italy
-
 Jamaica
-
 Japan
Japan
-
 Jordan
-
 Kazakhstan
-
 Kenya
Kenya
-
 Korea
Korea
-
 Kuwait
-
 Kyrgyzstan
-
 Laos
Laos
-
 Latvia
-
 Lebanon
-
 Lesotho
-
 Libya
Libya
-
 Lithuania
-
 Luxembourg
-
 Madagascar
-
 Malaysia
-
 Malta
Malta
-
 Mauritius
-
 Mexico
-
 Moldova
-
 Mongolia
-
 Montenegro
-
 Morocco
-
 Mozambique
-
 Myanmar
-
 Namibia
-
 Nepal
Nepal
-
 Netherlands
-
 New Zealand
-
 Nigeria
-
 North Macedonia
-
 Norway
-
 Oman
Oman
-
 Pakistan
-
 Palestine
-
 Panama
-
 Papua New Guinea
-
 Paraguay
-
 Peru
Peru
-
 Philippines
-
 Poland
-
 Portugal
-
 Puerto Rico
-
 Qatar
Qatar
-
 Reunion
-
 Romania
-
 Rwanda
-
 Saudi Arabia
-
 Serbia
-
 Singapore
-
 Slovakia
-
 Slovenia
-
 Somalia
-
 South Africa
-
 Spain
Spain
-
 Sri Lanka
-
 Sweden
-
 Switzerland
-
 Syria
Syria
-
 Taiwan
-
 Tajikistan
-
 Tanzania
-
 Thailand
-
 Trinidad and Tobago
-
 Tunisia
-
 Turkey
-
 UAE
UAE
-
 Uganda
-
 Ukraine
-
 United Kingdom
-
United States
-
 Uruguay
-
 Uzbekistan
-
 Venezuela
-
 Vietnam
-
 Yemen
Yemen
-
 Zambia
-
 Zimbabwe
- Forex
- Crypto












