

HBAR slides around 8.5% as price action stalls near key support despite positive momentum signals

Hedera (HBAR) fell 8.4% as selling pressure surged following a downside gap, even as recent enterprise adoption and network usage continued to garner attention. The downside move looks limited, with HBAR holding above its 50- and 200-day moving averages and support emerging nearby.
 0.0721
0.0776
Highlights
- Hedera leverages hashgraph technology and targets enterprise use cases in payments, tokenization, and decentralized applications, with HBAR operating under a fixed supply model.
- HBAR maintains a market capitalization near $4 billion, seeing recent small ETF flows and being compared to other sub-$1 digital assets, though its price faces broad selling pressure.
- HBAR/USD trades below its 20-day average with short-term downside but retains a bullish medium- and long-term structure, expected to range between $0.0852 and $0.0979 over five days.
Growth potential highlighted as ETF flows and sentiment diverge
Hedera is recognized for its enterprise-oriented distributed ledger technology based on hashgraph, supporting applications in payments, tokenization, and decentralized services. The network's native asset, HBAR, operates within a capped supply structure and was recently associated with a market capitalization of approximately $4 billion. Small ETF flows involving Hedera were reported from late September to early October, accompanied by comparisons highlighting its growth prospects among sub-$1 digital assets, though price action has remained under broader selling pressure.
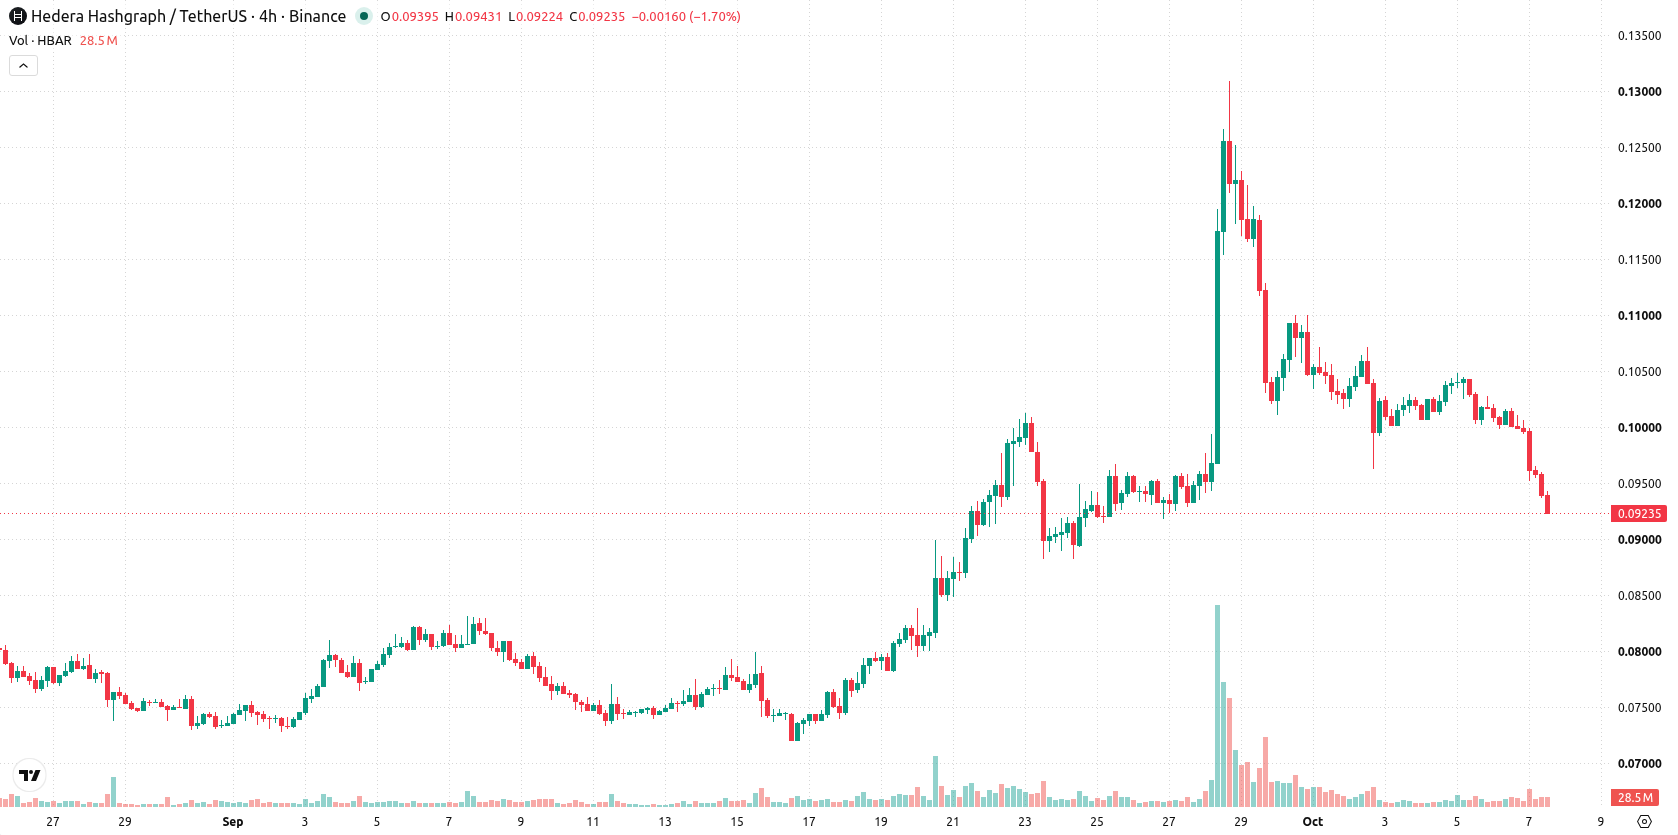
Short-term sellers challenge bullish trend amid mixed signals
HBAR/USD is trading below its 20-day moving average at $0.0963, but remains above both its 50-day and 200-day moving averages at $0.0844 and $0.082, respectively. This setup points to short-term pressure from sellers, with medium- and long-term structure still signaling a bullish alignment. The nearest resistance is the near-term ceiling at $0.0934, and support emerges at the near-term floor of $0.0852. Momentum signals show continued positive bias, as the Moving Average Convergence Divergence (MACD) and Average Directional Index (ADX) both indicate buy conditions. The Relative Strength Index (RSI) stands at 56.84, with the Stochastic RSI at an oversold reading of 0. The Commodity Channel Index (CCI) suggests a neutral stance. Bull/Bear Power (BBP) is positive, indicating buyers dominate intraday momentum, with the oversold signal from the Stochastic RSI pointing to potential near-term relief. The current price is $0.0924, representing a daily decline of $0.0085, or 8.4%, following a downside gap near 1.19%. Price action remains near the day's lows, with intraday volatility at 6.96%. There is clear pressure after the open, yet momentum signals present a mixed narrative with some oversold conditions suggesting caution.
Previously it was reported that Hedera faced persistent selling pressure and downside risk, despite platform developments and active institutional interest. The latest technical setup suggests that while short-term volatility persists, traders should watch for a decisive move above $0.0979 or below $0.0852 to determine the next directional trend.






Latest HBAR News




-
 Afghanistan
-
 Albania
-
 Algeria
-
 Angola
-
 Argentina
-
 Armenia
-
 Australia
-
 Austria
-
 Azerbaijan
-
 Bahamas
-
 Bahrain
-
 Bangladesh
-
 Belarus
-
 Belgium
-
 Bolivia
-
 Botswana
-
 Brazil
-
 Brunei
-
 Bulgaria
-
 Cambodia
-
 Cameroon
-
 Canada
-
 Chile
-
 China
-
 Colombia
-
 Congo
-
 Costa Rica
-
 Cote d'Ivoire
-
 Croatia
-
 Cuba
-
 Cyprus
-
 Czechia
-
 DR Congo
-
 Denmark
-
 Dominican Republic
-
 Ecuador
-
 Egypt
-
 El Salvador
-
 Estonia
-
 Eswatini
-
 Ethiopia
-
 Finland
-
 France
-
 Georgia
-
 Germany
-
 Ghana
-
 Greece
-
 Haiti
-
 Hong Kong
-
 Hungary
-
 India
-
 Indonesia
-
 Iran, Islamic republic
-
 Iraq
-
 Ireland
-
 Israel
-
 Italy
-
 Jamaica
-
 Japan
-
 Jordan
-
 Kazakhstan
-
 Kenya
-
 Korea
-
 Kuwait
-
 Kyrgyzstan
-
 Laos
-
 Latvia
-
 Lebanon
-
 Lesotho
-
 Libya
-
 Lithuania
-
 Luxembourg
-
 Madagascar
-
 Malaysia
-
 Malta
-
 Mauritius
-
 Mexico
-
 Moldova
-
 Mongolia
-
 Montenegro
-
 Morocco
-
 Mozambique
-
 Myanmar
-
 Namibia
-
 Nepal
-
 Netherlands
-
 New Zealand
-
 Nigeria
-
 North Macedonia
-
 Norway
-
 Oman
-
 Pakistan
-
 Palestine
-
 Panama
-
 Papua New Guinea
-
 Paraguay
-
 Peru
-
 Philippines
-
 Poland
-
 Portugal
-
 Puerto Rico
-
 Qatar
-
 Reunion
-
 Romania
-
 Rwanda
-
 Saudi Arabia
-
 Serbia
-
 Singapore
-
 Slovakia
-
 Slovenia
-
 Somalia
-
 South Africa
-
 Spain
-
 Sri Lanka
-
 Sweden
-
 Switzerland
-
 Syria
-
 Taiwan
-
 Tajikistan
-
 Tanzania
-
 Thailand
-
 Trinidad and Tobago
-
 Tunisia
-
 Turkey
-
 UAE
-
 Uganda
-
 Ukraine
-
 United Kingdom
-
United States
-
 Uruguay
-
 Uzbekistan
-
 Venezuela
-
 Vietnam
-
 Yemen
-
 Zambia
-
 Zimbabwe
- Forex
- Crypto












