

Hedera drops as bearish momentum and oversold signals persist

Hedera (HBAR) is trading at $0.087, down 7.55% for the session and positioned below its key moving averages on short- and medium-term horizons, while still holding above longer-term support levels.
 0.0888
0.0999
0.0888
0.0999
Highlights
- HashPack enabled trading of tokenised stocks like Apple and SPY using HBAR or USDC, expanding Hedera network utility.
- Hedera introduced Agent Accounts for automated and AI-driven budget controls on HBAR and USDC payments, laying groundwork for programmable finance.
- HBAR/USD trades below key moving averages with strong short-term bearish momentum, likely to range $0.0838 to $0.0902 over the next 2 to 3 days.
Tokenized stocks and automation expand HBAR’s utility but depend on adoption
On October 8, 2026, HashPack, the largest wallet on the Hedera network, enabled trading of tokenised stocks such as Apple, Nvidia, Tesla, and the S&P 500 ETF SPY, with payments settled in HBAR or USDC; these tokens are provided by a third party and not issued by Hedera itself. This action expands Hedera’s ecosystem utility by creating a new channel for transactional demand and broadening use cases for HBAR, though the impact will depend on user adoption. The same day also saw the launch of Agent Accounts by Hedera, introducing automated and AI-driven budget controls for making HBAR and USDC payments using integrations like ChatGPT and Claude — a development that lays foundational groundwork for programmable finance on the network, according to Blockchain.
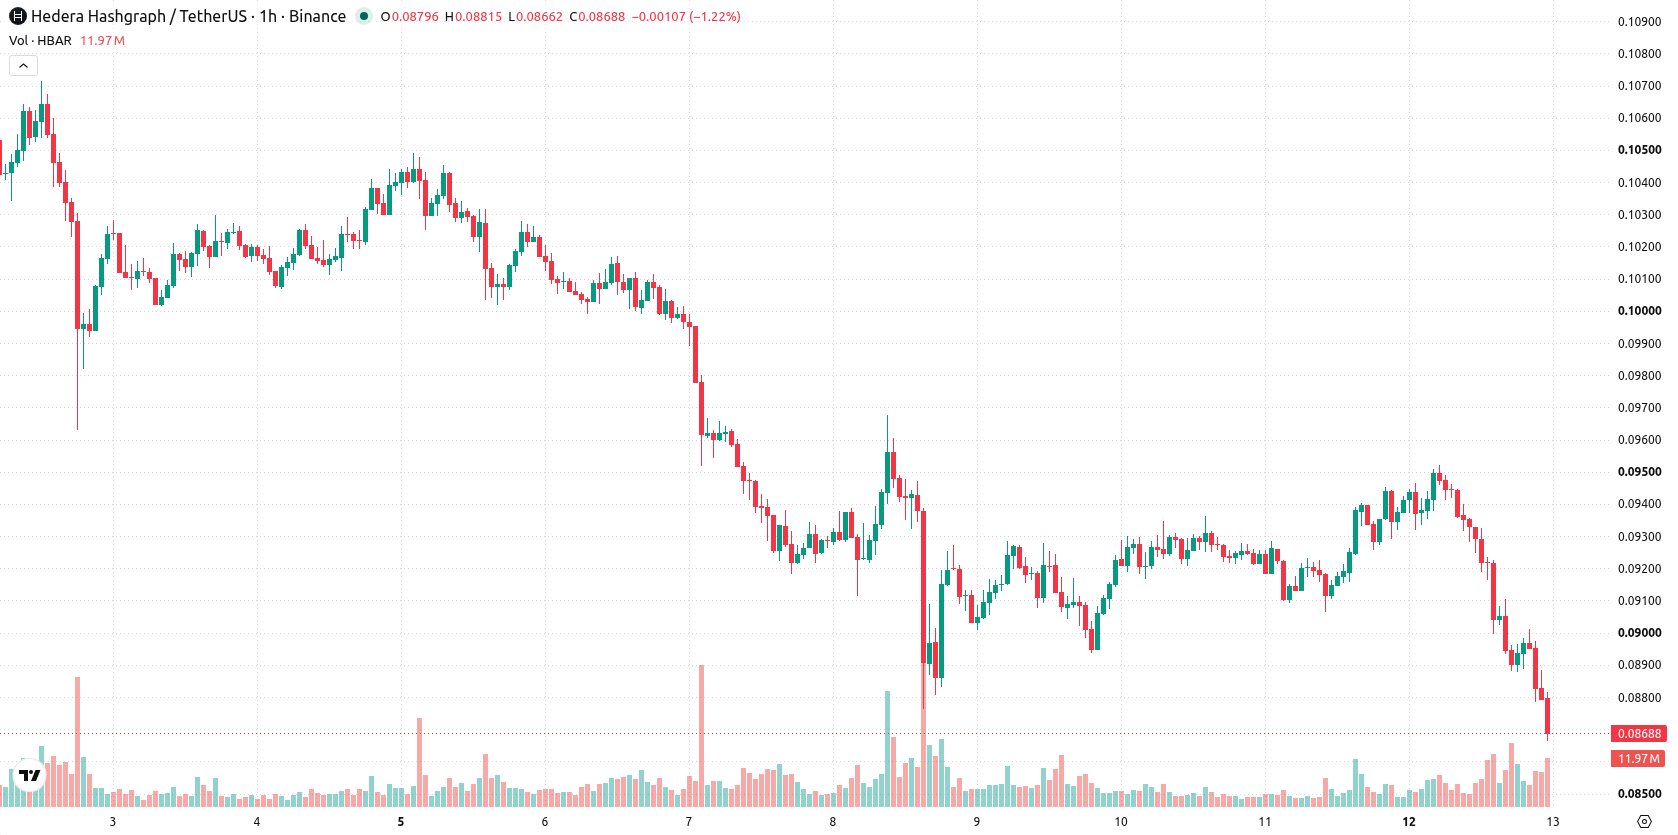
Seller control persists as major oscillators diverge below resistance
On the technical side, HBAR/USD is trading below the MA-20 at $0.0918 and MA-50 at $0.0923, but remains above the MA-200 at $0.0819. The Ichimoku Kijun level at $0.0915 is acting as the next resistance for price advances. Momentum monitors such as MACD and ADX both indicate sell signals, while the Awesome Oscillator remains aligned with recent downside pressure. RSI and CCI are in deeply oversold territory, whereas Stoch RSI shows a strong buy, highlighting a divergence among oscillators. Bull/Bear Power continues to point toward significant seller dominance, and trading is near the session low with heightened volatility.
Sideways trade likely as resistance caps upside and volatility persists
Over the coming 2–3 trading days, HBAR/USD is expected to remain in a volatile band between $0.0838 and $0.0902. The probability of an upside move is estimated at 21%, with the baseline scenario favoring sideways action below immediate resistance at $0.0915. A break above the Ichimoku Kijun level would be required to trigger a potential bullish scenario, while further selling toward $0.0838 is likely if support does not hold.
Earlier, analysts noted that despite mounting selling pressure, Hedera's long-term structure remained broadly constructive even as short-term volatility increased. The latest developments around expanded tokenized stock trading and programmable finance strengthen the network’s use case foundation, but with momentum technicals firmly negative, traders should monitor for either continued range-bound movement or a decisive shift should price breach the $0.0915 resistance or fall under $0.0838 support.










-
 Afghanistan
-
 Albania
-
 Algeria
-
 Angola
-
 Argentina
-
 Armenia
-
 Australia
-
 Austria
-
 Azerbaijan
-
 Bahamas
-
 Bahrain
-
 Bangladesh
-
 Belarus
-
 Belgium
-
 Bolivia
-
 Botswana
-
 Brazil
-
 Brunei
-
 Bulgaria
-
 Cambodia
-
 Cameroon
-
 Canada
-
 Chile
Chile
-
 China
China
-
 Colombia
-
 Congo
Congo
-
 Costa Rica
-
 Cote d'Ivoire
-
 Croatia
-
 Cuba
Cuba
-
 Cyprus
-
 Czechia
-
 DR Congo
-
 Denmark
-
 Dominican Republic
-
 Ecuador
-
 Egypt
Egypt
-
 El Salvador
-
 Estonia
-
 Eswatini
-
 Ethiopia
-
 Finland
-
 France
-
 Georgia
-
 Germany
-
 Ghana
Ghana
-
 Greece
-
 Haiti
Haiti
-
 Hong Kong
-
 Hungary
-
 India
India
-
 Indonesia
-
 Iran, Islamic republic
-
 Iraq
Iraq
-
 Ireland
-
 Israel
-
 Italy
Italy
-
 Jamaica
-
 Japan
Japan
-
 Jordan
-
 Kazakhstan
-
 Kenya
Kenya
-
 Korea
Korea
-
 Kuwait
-
 Kyrgyzstan
-
 Laos
Laos
-
 Latvia
-
 Lebanon
-
 Lesotho
-
 Libya
Libya
-
 Lithuania
-
 Luxembourg
-
 Madagascar
-
 Malaysia
-
 Malta
Malta
-
 Mauritius
-
 Mexico
-
 Moldova
-
 Mongolia
-
 Montenegro
-
 Morocco
-
 Mozambique
-
 Myanmar
-
 Namibia
-
 Nepal
Nepal
-
 Netherlands
-
 New Zealand
-
 Nigeria
-
 North Macedonia
-
 Norway
-
 Oman
Oman
-
 Pakistan
-
 Palestine
-
 Panama
-
 Papua New Guinea
-
 Paraguay
-
 Peru
Peru
-
 Philippines
-
 Poland
-
 Portugal
-
 Puerto Rico
-
 Qatar
Qatar
-
 Reunion
-
 Romania
-
 Rwanda
-
 Saudi Arabia
-
 Serbia
-
 Singapore
-
 Slovakia
-
 Slovenia
-
 Somalia
-
 South Africa
-
 Spain
Spain
-
 Sri Lanka
-
 Sweden
-
 Switzerland
-
 Syria
Syria
-
 Taiwan
-
 Tajikistan
-
 Tanzania
-
 Thailand
-
 Trinidad and Tobago
-
 Tunisia
-
 Turkey
-
 UAE
UAE
-
 Uganda
-
 Ukraine
-
 United Kingdom
-
United States
-
 Uruguay
-
 Uzbekistan
-
 Venezuela
-
 Vietnam
-
 Yemen
Yemen
-
 Zambia
-
 Zimbabwe
- Forex
- Crypto












