

Hedera sellers hold control as token slips toward $0.0876 support: weekly analysis

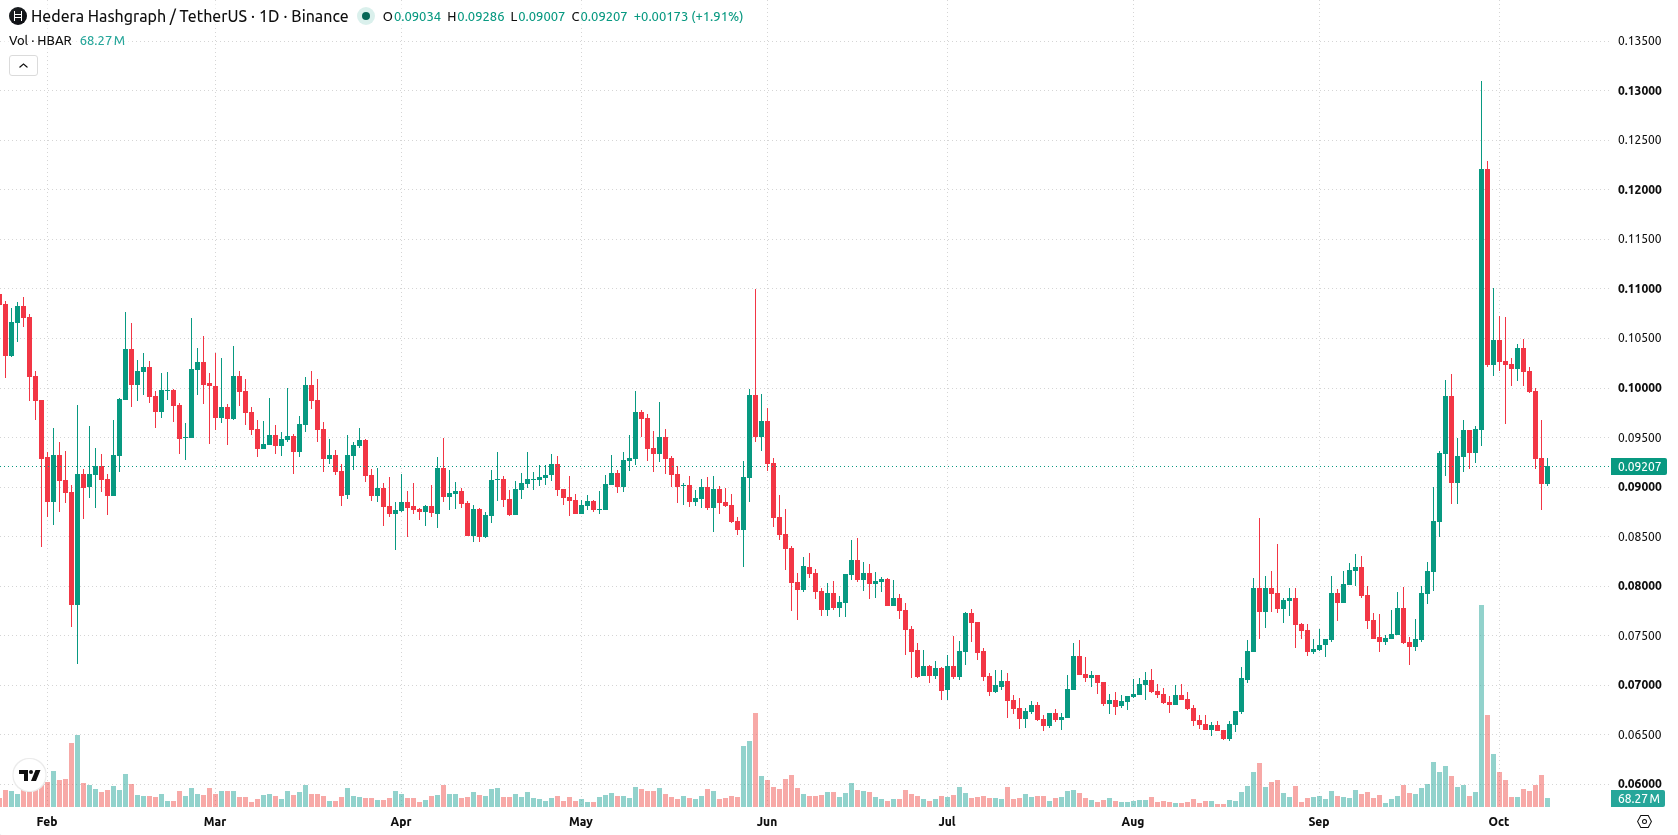
Hedera (HBAR) is trading near $0.09 after a sharp slide of around 13% this week, with technicals highlighting mounting selling pressure and overstretched downside momentum. Conflicting signals from volatility and oscillators point to a critical test for support, as traders weigh whether recent declines could set the stage for stabilization or deeper weakness in the days ahead.
 0.0724
0.0781
Highlights
- Hedera has dropped 12.7% over the past 7 days and is trading at $0.0921 in a bearish short-term structure.
- Mixed momentum signals include a positive MACD and oversold Stochastic RSI, with further pressure likely unless buyers hold the $0.0876 support.
- Expected 7-day range is $0.0829 to $0.1012, with base case consolidation and repeated tests of $0.0876 support and $0.0978 resistance.
Institutional adoption advances as tokenized asset trades and ETF flows shape sentiment
The week's key driver for HBAR came as Aberdeen, Lloyds Bank, and Archax executed the UK's first foreign exchange trades using tokenized real-world assets on the network, according to Coinfomania, underscoring progress in institutional adoption. ETF products offering exposure to HBAR accumulated $80 million in net assets as of October 5 per openPR.com, though recent net inflows remained modest, signaling fluctuating institutional appetite. The SEC and CFTC's classification of HBAR as a digital commodity, cited by Changelly.com, continues to support more regulated investment product initiatives, while new AI and agent-related features from Hedera target ongoing enterprise engagement.
Mixed momentum emerges as MACD diverges from oversold RSI and bearish HMA
On the daily chart, Hedera has logged a sustained move lower with a firm trend, further underlined by 19.75% volatility this week. Momentum is mixed: the MACD maintains a positive bias for now, but the Stochastic RSI sits in oversold territory at 0, and the HMA has turned bearish. Immediate support lies at $0.0876, while resistance is at $0.0978, with the Ichimoku Kijun at $0.1015 offering a secondary cap if any recovery gains traction. Together, these dynamics tilt the setup toward further pressure in the short term unless buyers step in at or above the support area.
Breakout risk builds as consolidation scenario faces key support and resistance tests
Over the next 7 days, the expected range is $0.0829 to $0.1012, with a 52% probability of an increase and a 48% probability of a decrease. The base case sees Hedera consolidating inside this range, repeatedly testing the $0.0978 resistance and $0.0876 support. A bullish break above $0.0978 could open a move toward the $0.1015 Kijun. If price slips below $0.0876 support, a deeper retracement toward $0.0829 becomes likely.
Earlier, analysts noted that despite persistent selling pressure, Hedera's long-term structure remained broadly constructive even as short-term volatility increased. With volatility now elevated and price action at a critical support area, traders should closely monitor the $0.0876 level for signs of stabilization or further downside risk in the coming sessions.






Latest HBAR News




-
 Afghanistan
-
 Albania
-
 Algeria
-
 Angola
-
 Argentina
-
 Armenia
-
 Australia
-
 Austria
-
 Azerbaijan
-
 Bahamas
-
 Bahrain
-
 Bangladesh
-
 Belarus
-
 Belgium
-
 Bolivia
-
 Botswana
-
 Brazil
-
 Brunei
-
 Bulgaria
-
 Cambodia
-
 Cameroon
-
 Canada
-
 Chile
-
 China
-
 Colombia
-
 Congo
-
 Costa Rica
-
 Cote d'Ivoire
-
 Croatia
-
 Cuba
-
 Cyprus
-
 Czechia
-
 DR Congo
-
 Denmark
-
 Dominican Republic
-
 Ecuador
-
 Egypt
-
 El Salvador
-
 Estonia
-
 Eswatini
-
 Ethiopia
-
 Finland
-
 France
-
 Georgia
-
 Germany
-
 Ghana
-
 Greece
-
 Haiti
-
 Hong Kong
-
 Hungary
-
 India
-
 Indonesia
-
 Iran, Islamic republic
-
 Iraq
-
 Ireland
-
 Israel
-
 Italy
-
 Jamaica
-
 Japan
-
 Jordan
-
 Kazakhstan
-
 Kenya
-
 Korea
-
 Kuwait
-
 Kyrgyzstan
-
 Laos
-
 Latvia
-
 Lebanon
-
 Lesotho
-
 Libya
-
 Lithuania
-
 Luxembourg
-
 Madagascar
-
 Malaysia
-
 Malta
-
 Mauritius
-
 Mexico
-
 Moldova
-
 Mongolia
-
 Montenegro
-
 Morocco
-
 Mozambique
-
 Myanmar
-
 Namibia
-
 Nepal
-
 Netherlands
-
 New Zealand
-
 Nigeria
-
 North Macedonia
-
 Norway
-
 Oman
-
 Pakistan
-
 Palestine
-
 Panama
-
 Papua New Guinea
-
 Paraguay
-
 Peru
-
 Philippines
-
 Poland
-
 Portugal
-
 Puerto Rico
-
 Qatar
-
 Reunion
-
 Romania
-
 Rwanda
-
 Saudi Arabia
-
 Serbia
-
 Singapore
-
 Slovakia
-
 Slovenia
-
 Somalia
-
 South Africa
-
 Spain
-
 Sri Lanka
-
 Sweden
-
 Switzerland
-
 Syria
-
 Taiwan
-
 Tajikistan
-
 Tanzania
-
 Thailand
-
 Trinidad and Tobago
-
 Tunisia
-
 Turkey
-
 UAE
-
 Uganda
-
 Ukraine
-
 United Kingdom
-
United States
-
 Uruguay
-
 Uzbekistan
-
 Venezuela
-
 Vietnam
-
 Yemen
-
 Zambia
-
 Zimbabwe
- Forex
- Crypto












