
Immutable X shows mixed momentum as Stochastic RSI enters overbought territory: weekly review

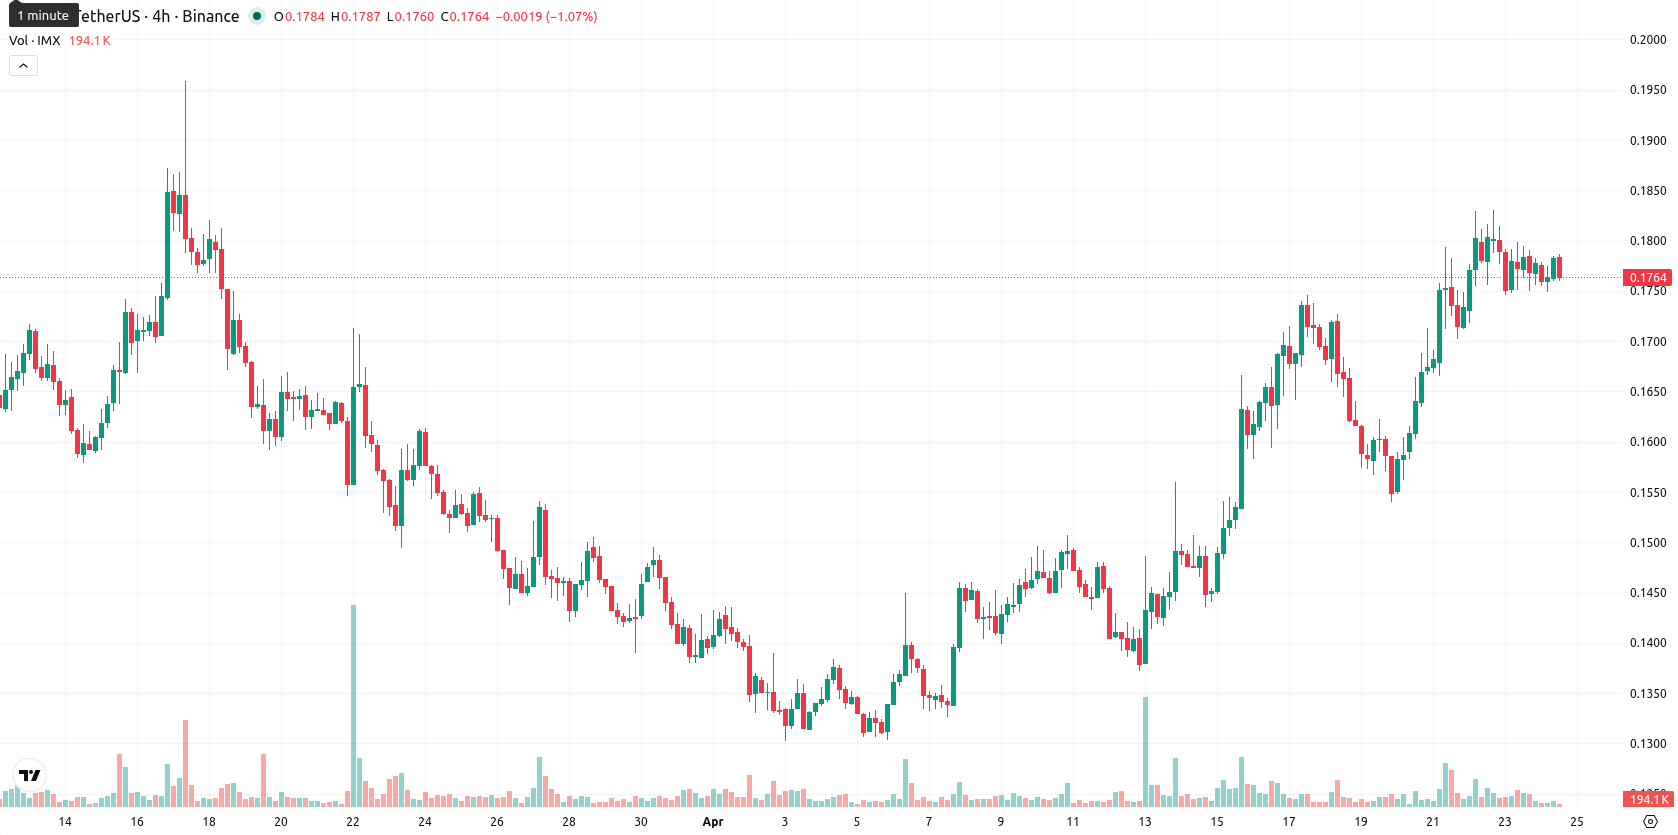
Immutable X (IMX) is currently priced at $0.1763, sitting below its weekly MA-20 ($0.1908), MA-50 ($0.3955), and MA-200 ($1.0053). Over the last week, IMX gained $0.0038 (2.20%), positioning itself in the upper part of the recent weekly range and remaining under medium- and long-term moving average resistance.
Highlights
- IMX remains in a bearish technical setup, consistently trading below key moving averages and signaling ongoing sell-side pressure.
- Momentum indicators show prevailing weakness, with negative MACD and ADX, and a low probability of a sustained upside breakout.
- IMX is expected to range between $0.1430 and $0.2090 next week, with resistance capping gains and downside risk dominant.
Bearish momentum persists as mixed technical signals emerge
On the weekly (W1) timeframe, volatility was notable at 18.83% as negative momentum indicators dominated. The MACD remains at 'Strong Sell,' with both ADX ('Sell') and RSI at 38.79 ('Sell'), underscoring lingering bearish pressure. The Stochastic RSI is in an overbought zone, signaling potential for a reversal or pullback. Key oscillators present a mixed picture, with CCI and Awesome Oscillator both neutral, and Bull/Bear Power indicating some buy-side support.
Sideways bias expected as indicator consensus limits breakout risk
For the next 7 days, IMX is projected to range between $0.1430 and $0.2090 in line with recent weekly volatility. There is less than a 20% chance of upward breakout, as none of the four key weekly indicators fall into Buy or Strong Buy territory. The baseline scenario expects sideways trading within the identified band, with resistance likely near $0.1908. If IMX falls below $0.1430, deeper declines could follow, while a break above $0.2090 would suggest a limited bullish attempt contained by prevailing medium-term resistance.
Earlier, analysts noted that despite short-term bullish momentum, Immutable X was still facing persistent longer-term downside risks and consolidation pressures. The current technical picture reinforces this cautious stance, suggesting that traders should monitor for a decisive move outside the $0.1430–$0.2090 weekly range to confirm any shift in trend direction.


-
 Afghanistan
-
 Albania
-
 Algeria
-
 Angola
-
 Argentina
-
 Armenia
-
 Australia
-
 Austria
-
 Azerbaijan
-
 Bahamas
-
 Bahrain
-
 Bangladesh
-
 Belarus
-
 Belgium
-
 Bolivia
-
 Botswana
-
 Brazil
-
 Brunei
-
 Bulgaria
-
 Cambodia
-
 Cameroon
-
 Canada
-
 Chile
Chile
-
 China
China
-
 Colombia
-
 Congo
Congo
-
 Costa Rica
-
 Cote d'Ivoire
-
 Croatia
-
 Cuba
Cuba
-
 Cyprus
-
 Czechia
-
 DR Congo
-
 Denmark
-
 Dominican Republic
-
 Ecuador
-
 Egypt
Egypt
-
 El Salvador
-
 Estonia
-
 Eswatini
-
 Ethiopia
-
 Finland
-
 France
-
 Georgia
-
 Germany
-
 Ghana
Ghana
-
 Greece
-
 Haiti
Haiti
-
 Hong Kong
-
 Hungary
-
 India
India
-
 Indonesia
-
 Iran, Islamic republic
-
 Iraq
Iraq
-
 Ireland
-
 Israel
-
 Italy
Italy
-
 Jamaica
-
 Japan
Japan
-
 Jordan
-
 Kazakhstan
-
 Kenya
Kenya
-
 Korea
Korea
-
 Kuwait
-
 Kyrgyzstan
-
 Laos
Laos
-
 Latvia
-
 Lebanon
-
 Lesotho
-
 Libya
Libya
-
 Lithuania
-
 Luxembourg
-
 Madagascar
-
 Malaysia
-
 Malta
Malta
-
 Mauritius
-
 Mexico
-
 Moldova
-
 Mongolia
-
 Montenegro
-
 Morocco
-
 Mozambique
-
 Myanmar
-
 Namibia
-
 Nepal
Nepal
-
 Netherlands
-
 New Zealand
-
 Nigeria
-
 North Macedonia
-
 Norway
-
 Oman
Oman
-
 Pakistan
-
 Palestine
-
 Panama
-
 Papua New Guinea
-
 Paraguay
-
 Peru
Peru
-
 Philippines
-
 Poland
-
 Portugal
-
 Puerto Rico
-
 Qatar
Qatar
-
 Reunion
-
 Romania
-
 Rwanda
-
 Saudi Arabia
-
 Serbia
-
 Singapore
-
 Slovakia
-
 Slovenia
-
 Somalia
-
 South Africa
-
 Spain
Spain
-
 Sri Lanka
-
 Sweden
-
 Switzerland
-
 Syria
Syria
-
 Taiwan
-
 Tajikistan
-
 Tanzania
-
 Thailand
-
 Trinidad and Tobago
-
 Tunisia
-
 Turkey
-
 UAE
UAE
-
 Uganda
-
 Ukraine
-
 United Kingdom
-
United States
-
 Uruguay
-
 Uzbekistan
-
 Venezuela
-
 Vietnam
-
 Yemen
Yemen
-
 Zambia
-
 Zimbabwe
- Forex
- Crypto
