
Bitcoin price prediction: Will $78,100 resistance cap BTC gains as trading stays flat?

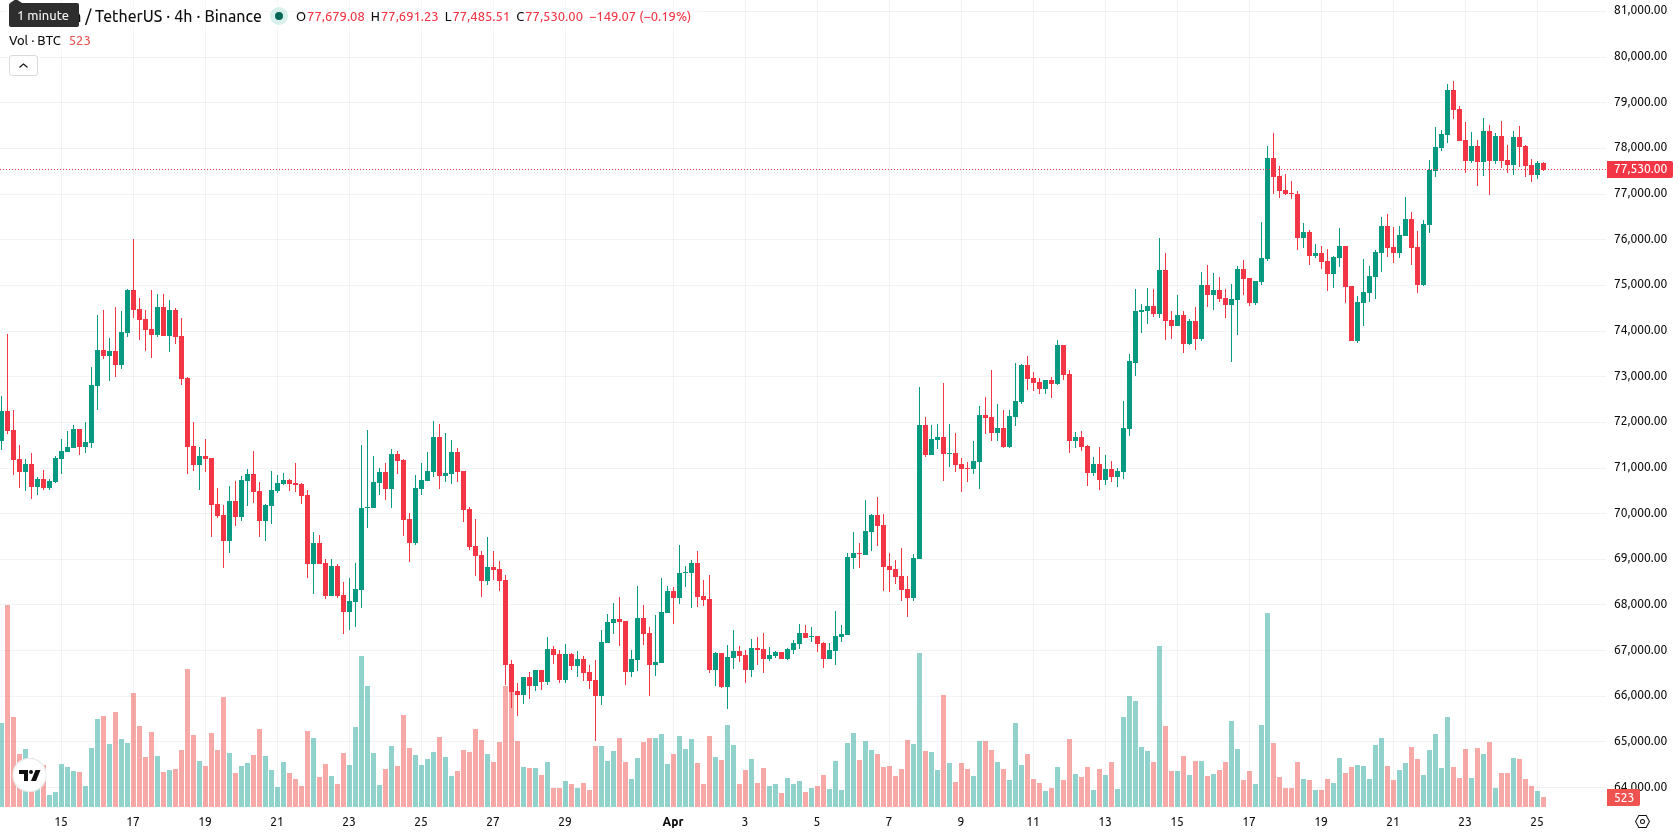
Bitcoin (BTC) is trading at $77,510.28, down 0.57% today. The asset remains above its key short- to medium-term moving averages while trading below longer-term benchmarks.
 65107.99
65600.00
65107.99
65600.00
Highlights
- Institutional and corporate accumulation continued, with Strategy purchasing 34,164 BTC and spot Bitcoin ETFs seeing $2.4 billion in April inflows.
- Satsuma Technology and Smarter Web Company raised their combined holdings by 66.77 BTC, with Smarter Web increasing leverage to 8.1% via Coinbase Credit.
- Bitcoin maintains a short- and medium-term bullish structure but faces overbought technicals and a likely sideways-to-lower trading range between $73,500 and $78,100 short-term.
Institutional accumulation and ETF inflows support despite leveraged risk
On April 24, Satsuma Technology PLC reported acquiring an additional 22.77 Bitcoin for about $1.8 million, increasing its holdings to 668.48 BTC and maintaining a debt-free balance sheet. The same day, Smarter Web Company PLC disclosed the purchase of 44 more Bitcoin for £2.51 million, reaching 2,750 BTC and raising its leverage to 8.1% via a Coinbase Credit facility. Bitcoin ETFs recorded $2 billion in inflows over eight consecutive days, and spot ETF inflows for April totaled $2.4 billion, which contributed to one of the strongest monthly performances in over a year. Strategy (formerly MicroStrategy) disclosed the purchase of 34,164 BTC for roughly $2.54 billion at an average price of $74,395, pushing its total to over 815,000 BTC, though price action has remained under broader selling pressure.
Mixed momentum as bitcoin straddles technical supports and overbought signals
BTC trades above the SMA-20 at $74,025.70 and SMA-50 at $71,159.39, but remains below the SMA-200 at $85,442.28. Key support is provided by the Ichimoku Kijun (D1) at $72,592.47. The D1 MACD stays in a buy position, while ADX is subdued at 16.35 and RSI stands at 62.13, indicating neutral to moderate momentum. Overbought conditions are signaled by both CCI and Bull/Bear Power (BBP), with persistent buyer dominance, but Stoch RSI reflects strong selling pressure. The Awesome Oscillator trends upward, highlighting ongoing positive momentum, though divergence among short-term oscillators warrants caution.
Sideways price action likely as upside fades and downside risks increase
Over the next five trading days, BTC is expected to trade within a volatility band of $73,500 to $78,100 relative to current levels. The chance of near-term price increases is low, with downside movement more likely. The base expectation is that the price will fluctuate sideways within this corridor. A move above $78,100 would signal bullish momentum, while a bearish break below $73,500 could accelerate declines toward support near the Ichimoku Kijun level.
Earlier, analysts noted that Bitcoin’s price remains highly sensitive to broader macroeconomic trends and the strength of the U.S. dollar, often exhibiting a pronounced inverse correlation. With Bitcoin showing sustained institutional demand but facing stronger technical resistance, traders should closely monitor the $73,500 support level as a potential trigger for renewed volatility in the days ahead.


Latest Bitcoin News







-
 Afghanistan
-
 Albania
-
 Algeria
-
 Angola
-
 Argentina
-
 Armenia
-
 Australia
-
 Austria
-
 Azerbaijan
-
 Bahamas
-
 Bahrain
-
 Bangladesh
-
 Belarus
-
 Belgium
-
 Bolivia
-
 Botswana
-
 Brazil
-
 Brunei
-
 Bulgaria
-
 Cambodia
-
 Cameroon
-
 Canada
-
 Chile
Chile
-
 China
China
-
 Colombia
-
 Congo
Congo
-
 Costa Rica
-
 Cote d'Ivoire
-
 Croatia
-
 Cuba
Cuba
-
 Cyprus
-
 Czechia
-
 DR Congo
-
 Denmark
-
 Dominican Republic
-
 Ecuador
-
 Egypt
Egypt
-
 El Salvador
-
 Estonia
-
 Eswatini
-
 Ethiopia
-
 Finland
-
 France
-
 Georgia
-
 Germany
-
 Ghana
Ghana
-
 Greece
-
 Haiti
Haiti
-
 Hong Kong
-
 Hungary
-
 India
India
-
 Indonesia
-
 Iran, Islamic republic
-
 Iraq
Iraq
-
 Ireland
-
 Israel
-
 Italy
Italy
-
 Jamaica
-
 Japan
Japan
-
 Jordan
-
 Kazakhstan
-
 Kenya
Kenya
-
 Korea
Korea
-
 Kuwait
-
 Kyrgyzstan
-
 Laos
Laos
-
 Latvia
-
 Lebanon
-
 Lesotho
-
 Libya
Libya
-
 Lithuania
-
 Luxembourg
-
 Madagascar
-
 Malaysia
-
 Malta
Malta
-
 Mauritius
-
 Mexico
-
 Moldova
-
 Mongolia
-
 Montenegro
-
 Morocco
-
 Mozambique
-
 Myanmar
-
 Namibia
-
 Nepal
Nepal
-
 Netherlands
-
 New Zealand
-
 Nigeria
-
 North Macedonia
-
 Norway
-
 Oman
Oman
-
 Pakistan
-
 Palestine
-
 Panama
-
 Papua New Guinea
-
 Paraguay
-
 Peru
Peru
-
 Philippines
-
 Poland
-
 Portugal
-
 Puerto Rico
-
 Qatar
Qatar
-
 Reunion
-
 Romania
-
 Rwanda
-
 Saudi Arabia
-
 Serbia
-
 Singapore
-
 Slovakia
-
 Slovenia
-
 Somalia
-
 South Africa
-
 Spain
Spain
-
 Sri Lanka
-
 Sweden
-
 Switzerland
-
 Syria
Syria
-
 Taiwan
-
 Tajikistan
-
 Tanzania
-
 Thailand
-
 Trinidad and Tobago
-
 Tunisia
-
 Turkey
-
 UAE
UAE
-
 Uganda
-
 Ukraine
-
 United Kingdom
-
United States
-
 Uruguay
-
 Uzbekistan
-
 Venezuela
-
 Vietnam
-
 Yemen
Yemen
-
 Zambia
-
 Zimbabwe
- Forex
- Crypto











