
Curve advances as price action stalls under MA-200 ceiling: weekly review

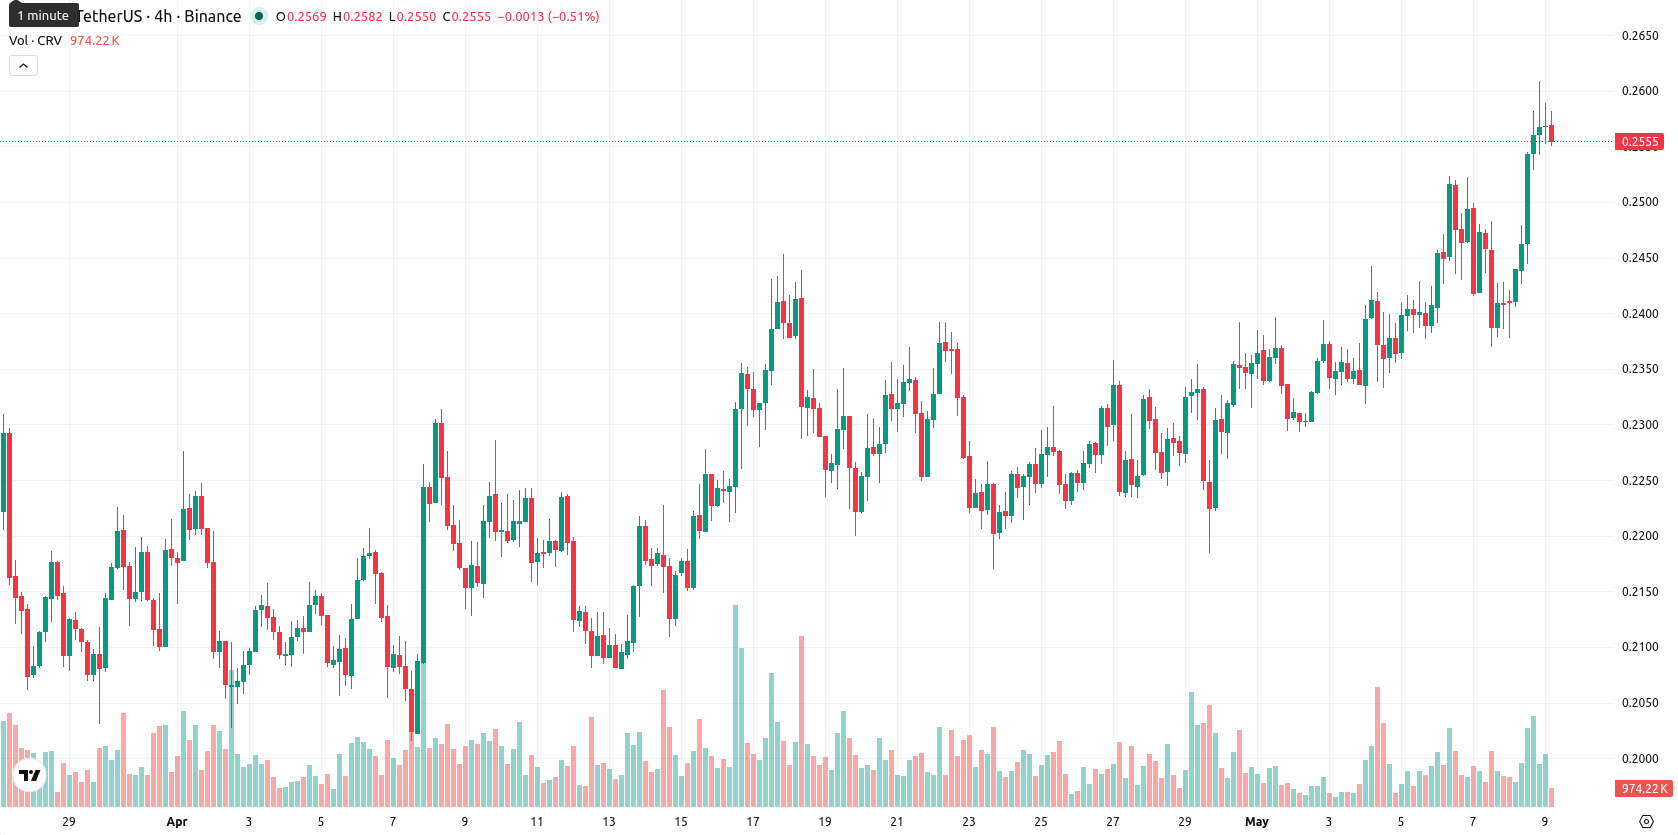
Curve (CRV) is currently trading at $0.2558 after a weekly rebound of $0.0252, representing a 10.97% gain from the previous close. Despite this sharp move, CRV remains below its weekly MA-20 ($0.2743), MA-50 ($0.4969), and MA-200 ($0.6149), continuing to face both medium- and long-term resistance.
Highlights
- Curve (CRV) trades below all key moving averages, signaling sustained medium- and long-term selling pressure.
- Despite a sharp weekly rebound of 10.97%, technical indicators reflect weak momentum and an overbought condition, suggesting limited upside.
- Price is expected to consolidate between $0.23 and $0.28 over the next week, with increased risk of pullback if support at $0.23 fails.
Mixed weekly momentum persists as overbought signals counter weak technicals
On the weekly timeframe, CRV closed the week strong at the very top of its seven-day range, but remains technically weak below all major moving averages. The MA-20 at $0.2743 is immediate dynamic resistance, while the next key areas are the MA-50 and MA-200, both well above recent price action. Weekly momentum is mixed: MACD and ADX suggest low or negative momentum, RSI rests at 39.54 hinting at mild selling pressure, and the Stochastic RSI signals CRV is overbought. Bull/Bear Power is slightly positive, but the Awesome Oscillator is neutral, reflecting limited conviction behind the bounce.
Consolidation bias prevails as indicator signals dampen upside outlook
Looking ahead to the next seven days, the weekly indicators favor a stabilization or mild pullback. The expected price range is $0.2290 to $0.2825, with a base case scenario for consolidation between $0.23 and $0.28. A sustained move above $0.27 would signal bullish momentum and open the way toward the upper bound at $0.2825, but with none of the four major indicators suggesting a buy, the likelihood of further upside is very low. If CRV drops below $0.23, the focus would likely shift toward retesting support close to $0.22.
Earlier, analysts noted that Curve remained under sustained bearish momentum with little sign of a meaningful recovery. The current technical setup reinforces this view, and traders should monitor CRV for stabilization between $0.23 and $0.28, with downside risk if support near $0.23 fails.


-
 Afghanistan
-
 Albania
-
 Algeria
-
 Angola
-
 Argentina
-
 Armenia
-
 Australia
-
 Austria
-
 Azerbaijan
-
 Bahamas
-
 Bahrain
-
 Bangladesh
-
 Belarus
-
 Belgium
-
 Bolivia
-
 Botswana
-
 Brazil
-
 Brunei
-
 Bulgaria
-
 Cambodia
-
 Cameroon
-
 Canada
-
 Chile
Chile
-
 China
China
-
 Colombia
-
 Congo
Congo
-
 Costa Rica
-
 Cote d'Ivoire
-
 Croatia
-
 Cuba
Cuba
-
 Cyprus
-
 Czechia
-
 DR Congo
-
 Denmark
-
 Dominican Republic
-
 Ecuador
-
 Egypt
Egypt
-
 El Salvador
-
 Estonia
-
 Eswatini
-
 Ethiopia
-
 Finland
-
 France
-
 Georgia
-
 Germany
-
 Ghana
Ghana
-
 Greece
-
 Haiti
Haiti
-
 Hong Kong
-
 Hungary
-
 India
India
-
 Indonesia
-
 Iran, Islamic republic
-
 Iraq
Iraq
-
 Ireland
-
 Israel
-
 Italy
Italy
-
 Jamaica
-
 Japan
Japan
-
 Jordan
-
 Kazakhstan
-
 Kenya
Kenya
-
 Korea
Korea
-
 Kuwait
-
 Kyrgyzstan
-
 Laos
Laos
-
 Latvia
-
 Lebanon
-
 Lesotho
-
 Libya
Libya
-
 Lithuania
-
 Luxembourg
-
 Madagascar
-
 Malaysia
-
 Malta
Malta
-
 Mauritius
-
 Mexico
-
 Moldova
-
 Mongolia
-
 Montenegro
-
 Morocco
-
 Mozambique
-
 Myanmar
-
 Namibia
-
 Nepal
Nepal
-
 Netherlands
-
 New Zealand
-
 Nigeria
-
 North Macedonia
-
 Norway
-
 Oman
Oman
-
 Pakistan
-
 Palestine
-
 Panama
-
 Papua New Guinea
-
 Paraguay
-
 Peru
Peru
-
 Philippines
-
 Poland
-
 Portugal
-
 Puerto Rico
-
 Qatar
Qatar
-
 Reunion
-
 Romania
-
 Rwanda
-
 Saudi Arabia
-
 Serbia
-
 Singapore
-
 Slovakia
-
 Slovenia
-
 Somalia
-
 South Africa
-
 Spain
Spain
-
 Sri Lanka
-
 Sweden
-
 Switzerland
-
 Syria
Syria
-
 Taiwan
-
 Tajikistan
-
 Tanzania
-
 Thailand
-
 Trinidad and Tobago
-
 Tunisia
-
 Turkey
-
 UAE
UAE
-
 Uganda
-
 Ukraine
-
 United Kingdom
-
United States
-
 Uruguay
-
 Uzbekistan
-
 Venezuela
-
 Vietnam
-
 Yemen
Yemen
-
 Zambia
-
 Zimbabwe
- Forex
- Crypto
