
CRV drops amid oversold RSI and downward momentum signals: weekly forecast

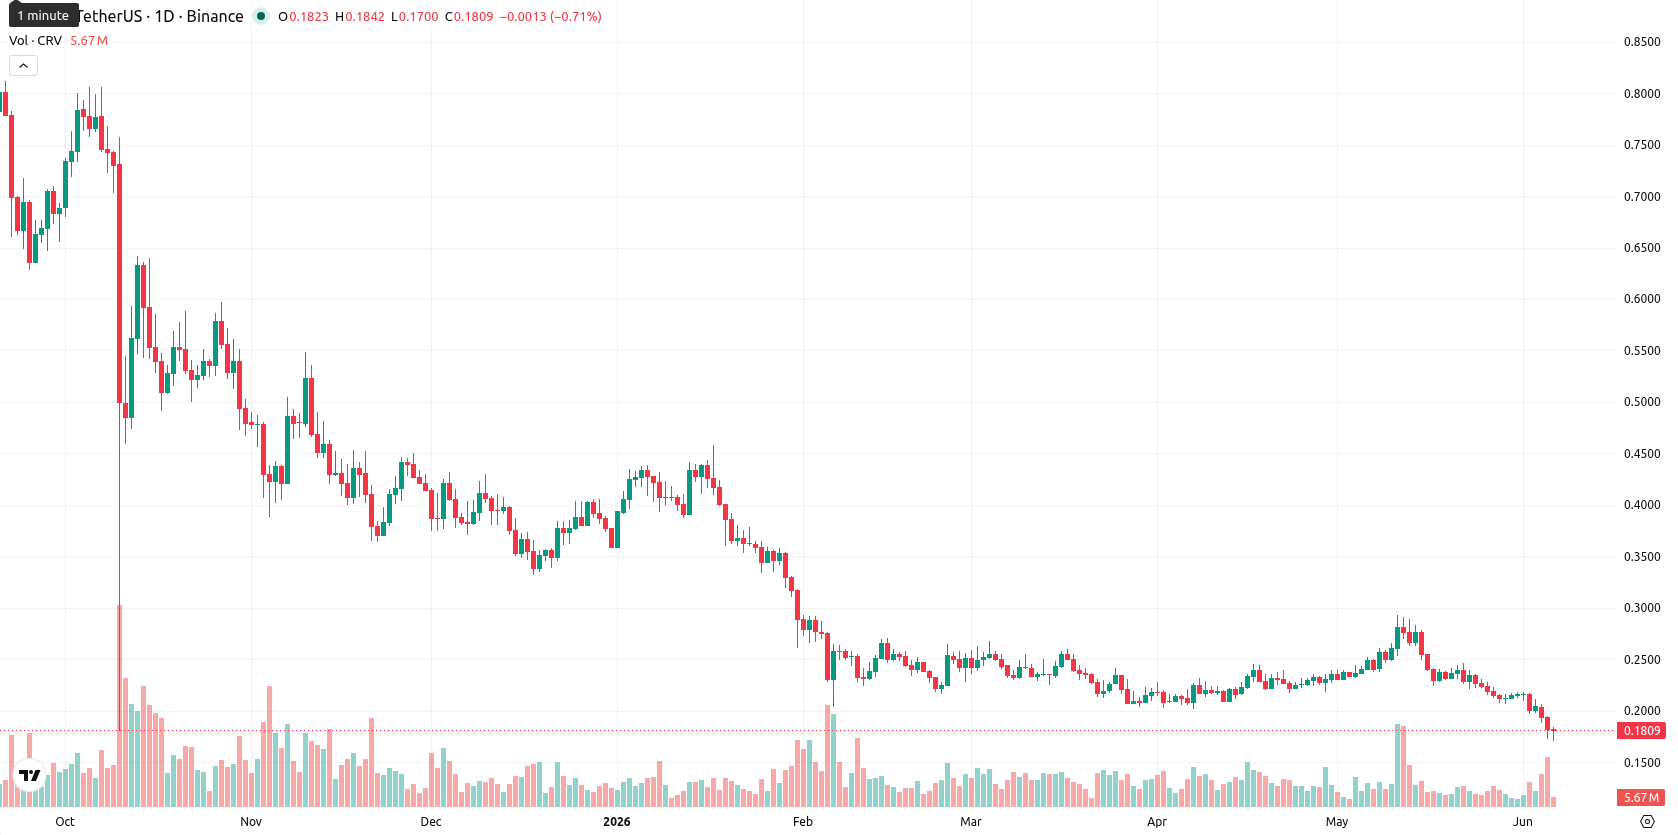
Curve (CRV) is currently trading at $0.1804 after a weekly decline of $0.0356, representing a loss of 16.20%. The price sits well below the weekly MA-20 ($0.2362), MA-50 ($0.4649), and MA-200 ($0.5933), reflecting a pronounced bearish trend and persistent pressure from sellers.
Highlights
- CRV remains entrenched in a bearish trend, trading well below major moving averages with persistent downside pressure.
- Momentum and oscillator indicators signal heavy oversold conditions, with sellers firmly controlling price action over the last week.
- Expected 7-day range is $0.1730 to $0.2160, with little chance of a rebound and higher risk of new multi-year lows.
Persistent oversold conditions as momentum signals intensify weekly decline
On the weekly chart, CRV remains decisively below all major moving averages. Both medium- and long-term trends are negative, with dynamic resistance established by the MA-20, MA-50, and MA-200. Weekly oscillators such as RSI, Stochastic RSI, and CCI are all in oversold territory, while the MACD and ADX continue to signal strong downward momentum. The Awesome Oscillator also fails to support any positive reversal. Immediate resistance is identified near $0.2160, while support is found at $0.1730, marking the current lower boundary of the range. Weekly volatility is elevated at 26.55%, underlining persistent selling.
Sideways to lower bias likely as breakout risk stays muted next week
Over the next 7 days, CRV is expected to trade within a range of $0.1730 to $0.2160, as indicated by weekly volatility and the technical setup. The probability of a sharp upward move remains low, with less than a 20% chance for a breakout above resistance. The most likely scenario is continued sideways to lower movement within this corridor, with no support from core weekly indicators. A close below $0.1730 may trigger fresh multi-year lows, while a surprise bullish shift would be required to challenge the $0.2160 resistance.
Previously it was reported that Curve was experiencing sustained bearish momentum with weak prospects for a short-term recovery. This outlook is reinforced by the continued negative trend across all major timeframes, making a close below $0.1730 the critical risk as downside volatility remains elevated.


-
 Afghanistan
-
 Albania
-
 Algeria
-
 Angola
-
 Argentina
-
 Armenia
-
 Australia
-
 Austria
-
 Azerbaijan
-
 Bahamas
-
 Bahrain
-
 Bangladesh
-
 Belarus
-
 Belgium
-
 Bolivia
-
 Botswana
-
 Brazil
-
 Brunei
-
 Bulgaria
-
 Cambodia
-
 Cameroon
-
 Canada
-
 Chile
Chile
-
 China
China
-
 Colombia
-
 Congo
Congo
-
 Costa Rica
-
 Cote d'Ivoire
-
 Croatia
-
 Cuba
Cuba
-
 Cyprus
-
 Czechia
-
 DR Congo
-
 Denmark
-
 Dominican Republic
-
 Ecuador
-
 Egypt
Egypt
-
 El Salvador
-
 Estonia
-
 Eswatini
-
 Ethiopia
-
 Finland
-
 France
-
 Georgia
-
 Germany
-
 Ghana
Ghana
-
 Greece
-
 Haiti
Haiti
-
 Hong Kong
-
 Hungary
-
 India
India
-
 Indonesia
-
 Iran, Islamic republic
-
 Iraq
Iraq
-
 Ireland
-
 Israel
-
 Italy
Italy
-
 Jamaica
-
 Japan
Japan
-
 Jordan
-
 Kazakhstan
-
 Kenya
Kenya
-
 Korea
Korea
-
 Kuwait
-
 Kyrgyzstan
-
 Laos
Laos
-
 Latvia
-
 Lebanon
-
 Lesotho
-
 Libya
Libya
-
 Lithuania
-
 Luxembourg
-
 Madagascar
-
 Malaysia
-
 Malta
Malta
-
 Mauritius
-
 Mexico
-
 Moldova
-
 Mongolia
-
 Montenegro
-
 Morocco
-
 Mozambique
-
 Myanmar
-
 Namibia
-
 Nepal
Nepal
-
 Netherlands
-
 New Zealand
-
 Nigeria
-
 North Macedonia
-
 Norway
-
 Oman
Oman
-
 Pakistan
-
 Palestine
-
 Panama
-
 Papua New Guinea
-
 Paraguay
-
 Peru
Peru
-
 Philippines
-
 Poland
-
 Portugal
-
 Puerto Rico
-
 Qatar
Qatar
-
 Reunion
-
 Romania
-
 Rwanda
-
 Saudi Arabia
-
 Serbia
-
 Singapore
-
 Slovakia
-
 Slovenia
-
 Somalia
-
 South Africa
-
 Spain
Spain
-
 Sri Lanka
-
 Sweden
-
 Switzerland
-
 Syria
Syria
-
 Taiwan
-
 Tajikistan
-
 Tanzania
-
 Thailand
-
 Trinidad and Tobago
-
 Tunisia
-
 Turkey
-
 UAE
UAE
-
 Uganda
-
 Ukraine
-
 United Kingdom
-
United States
-
 Uruguay
-
 Uzbekistan
-
 Venezuela
-
 Vietnam
-
 Yemen
Yemen
-
 Zambia
-
 Zimbabwe
- Forex
- Crypto
