
CRV trades within recent range as momentum indicators favor sideways movement: weekly report

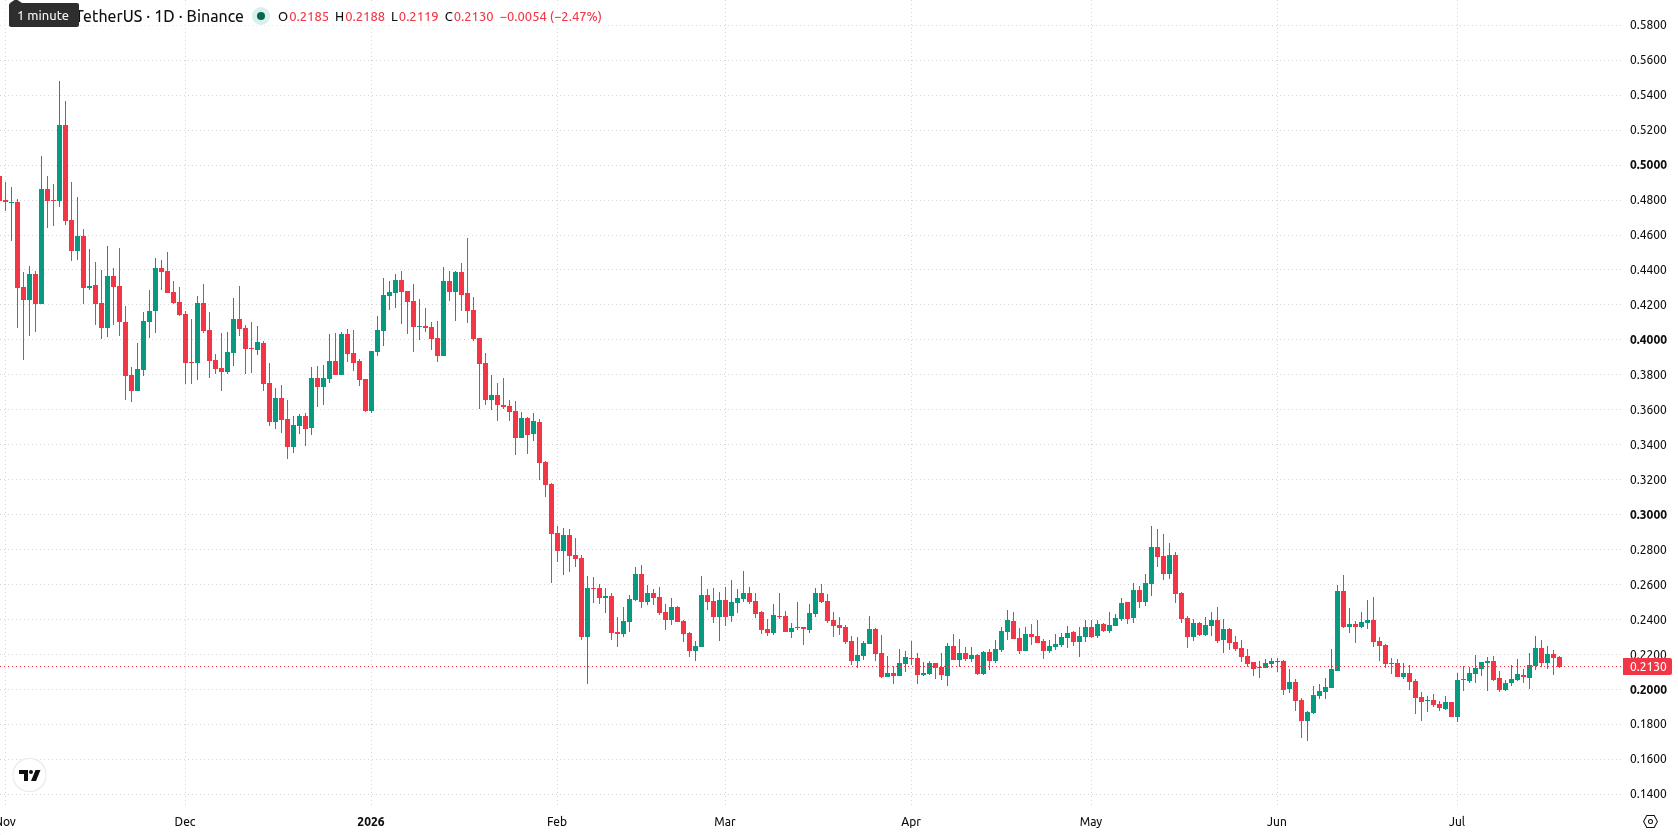
Curve (CRV) is currently trading at $0.2131, reflecting a weekly gain of $0.0064 (3.10%). The price remains below its weekly MA-20 ($0.2206), MA-50 ($0.3989), and MA-200 ($0.5667), indicating continued downward pressure from medium- and long-term moving averages.
 0.2149
0.2303
0.2149
0.2303
Highlights
- CRV continues to trade under significant technical pressure, remaining below multiple major moving averages and confirming an ongoing bearish market structure.
- Momentum indicators overwhelmingly reflect seller control, with the MACD signaling a strong sell and supporting weak bullish momentum.
- CRV is likely to trade sideways between $0.2004 and $0.2259 over the next week, with a higher risk of downside below $0.2004.
LlamaLend V2 launch strengthens Curve’s DeFi position amid governance rollout
LlamaLend V2 launched on Ethereum, introducing isolated lending markets with support for Curve LP token collateral. This deployment is progressing in stages under Curve’s governance process. These developments are designed to strengthen Curve’s presence within the DeFi lending space.
Bearish momentum deepens during week as technicals reinforce downside bias
On the weekly timeframe, CRV remains under bearish technical pressure, with the price trading below its MA-20, MA-50, and MA-200, while the Ichimoku Kijun level sits well above, acting as dynamic resistance. Momentum indicators reinforce a negative outlook: the weekly MACD signals a strong sell, ADX indicates a weak trend, and RSI is in the sell zone at 41.3. Stochastic RSI is sharply overbought, CCI is neutral, and Bull/Bear Power shows a minor buyer advantage that is contradicted by broader selling signals in other indicators. The nearest resistance aligns with the MA-20 at $0.2206, while key weekly support is at $0.2004 and resistance is capped at $0.2259. Weekly volatility remains elevated at 15.15%.
Sideways outlook as negative signals limit breakout potential next week
For the coming 7 days, CRV is expected to trade sideways within a range of $0.2004 to $0.2259 as none of the main weekly technical indicators support a sustained bullish scenario. There is a low probability for a breakout above $0.2259, given the persistent seller dominance and lack of positive momentum signals. The base case is consolidation within the defined range, while a sustained move below $0.2004 would increase downside risk in line with ongoing negative technical trends.
Earlier, analysts noted that Curve was experiencing short-term bullish momentum despite an overall bearish longer-term technical outlook. The current analysis reinforces this negative bias, so traders should closely monitor the $0.2004 support level, as a breach could intensify downside risk in the coming sessions.


Latest Curve News




-
 Afghanistan
-
 Albania
-
 Algeria
-
 Angola
-
 Argentina
-
 Armenia
-
 Australia
-
 Austria
-
 Azerbaijan
-
 Bahamas
-
 Bahrain
-
 Bangladesh
-
 Belarus
-
 Belgium
-
 Bolivia
-
 Botswana
-
 Brazil
-
 Brunei
-
 Bulgaria
-
 Cambodia
-
 Cameroon
-
 Canada
-
 Chile
Chile
-
 China
China
-
 Colombia
-
 Congo
Congo
-
 Costa Rica
-
 Cote d'Ivoire
-
 Croatia
-
 Cuba
Cuba
-
 Cyprus
-
 Czechia
-
 DR Congo
-
 Denmark
-
 Dominican Republic
-
 Ecuador
-
 Egypt
Egypt
-
 El Salvador
-
 Estonia
-
 Eswatini
-
 Ethiopia
-
 Finland
-
 France
-
 Georgia
-
 Germany
-
 Ghana
Ghana
-
 Greece
-
 Haiti
Haiti
-
 Hong Kong
-
 Hungary
-
 India
India
-
 Indonesia
-
 Iran, Islamic republic
-
 Iraq
Iraq
-
 Ireland
-
 Israel
-
 Italy
Italy
-
 Jamaica
-
 Japan
Japan
-
 Jordan
-
 Kazakhstan
-
 Kenya
Kenya
-
 Korea
Korea
-
 Kuwait
-
 Kyrgyzstan
-
 Laos
Laos
-
 Latvia
-
 Lebanon
-
 Lesotho
-
 Libya
Libya
-
 Lithuania
-
 Luxembourg
-
 Madagascar
-
 Malaysia
-
 Malta
Malta
-
 Mauritius
-
 Mexico
-
 Moldova
-
 Mongolia
-
 Montenegro
-
 Morocco
-
 Mozambique
-
 Myanmar
-
 Namibia
-
 Nepal
Nepal
-
 Netherlands
-
 New Zealand
-
 Nigeria
-
 North Macedonia
-
 Norway
-
 Oman
Oman
-
 Pakistan
-
 Palestine
-
 Panama
-
 Papua New Guinea
-
 Paraguay
-
 Peru
Peru
-
 Philippines
-
 Poland
-
 Portugal
-
 Puerto Rico
-
 Qatar
Qatar
-
 Reunion
-
 Romania
-
 Rwanda
-
 Saudi Arabia
-
 Serbia
-
 Singapore
-
 Slovakia
-
 Slovenia
-
 Somalia
-
 South Africa
-
 Spain
Spain
-
 Sri Lanka
-
 Sweden
-
 Switzerland
-
 Syria
Syria
-
 Taiwan
-
 Tajikistan
-
 Tanzania
-
 Thailand
-
 Trinidad and Tobago
-
 Tunisia
-
 Turkey
-
 UAE
UAE
-
 Uganda
-
 Ukraine
-
 United Kingdom
-
United States
-
 Uruguay
-
 Uzbekistan
-
 Venezuela
-
 Vietnam
-
 Yemen
Yemen
-
 Zambia
-
 Zimbabwe
- Forex
- Crypto











