
Pudgy Penguins drops with relentless intraday selling pressure weighing on price

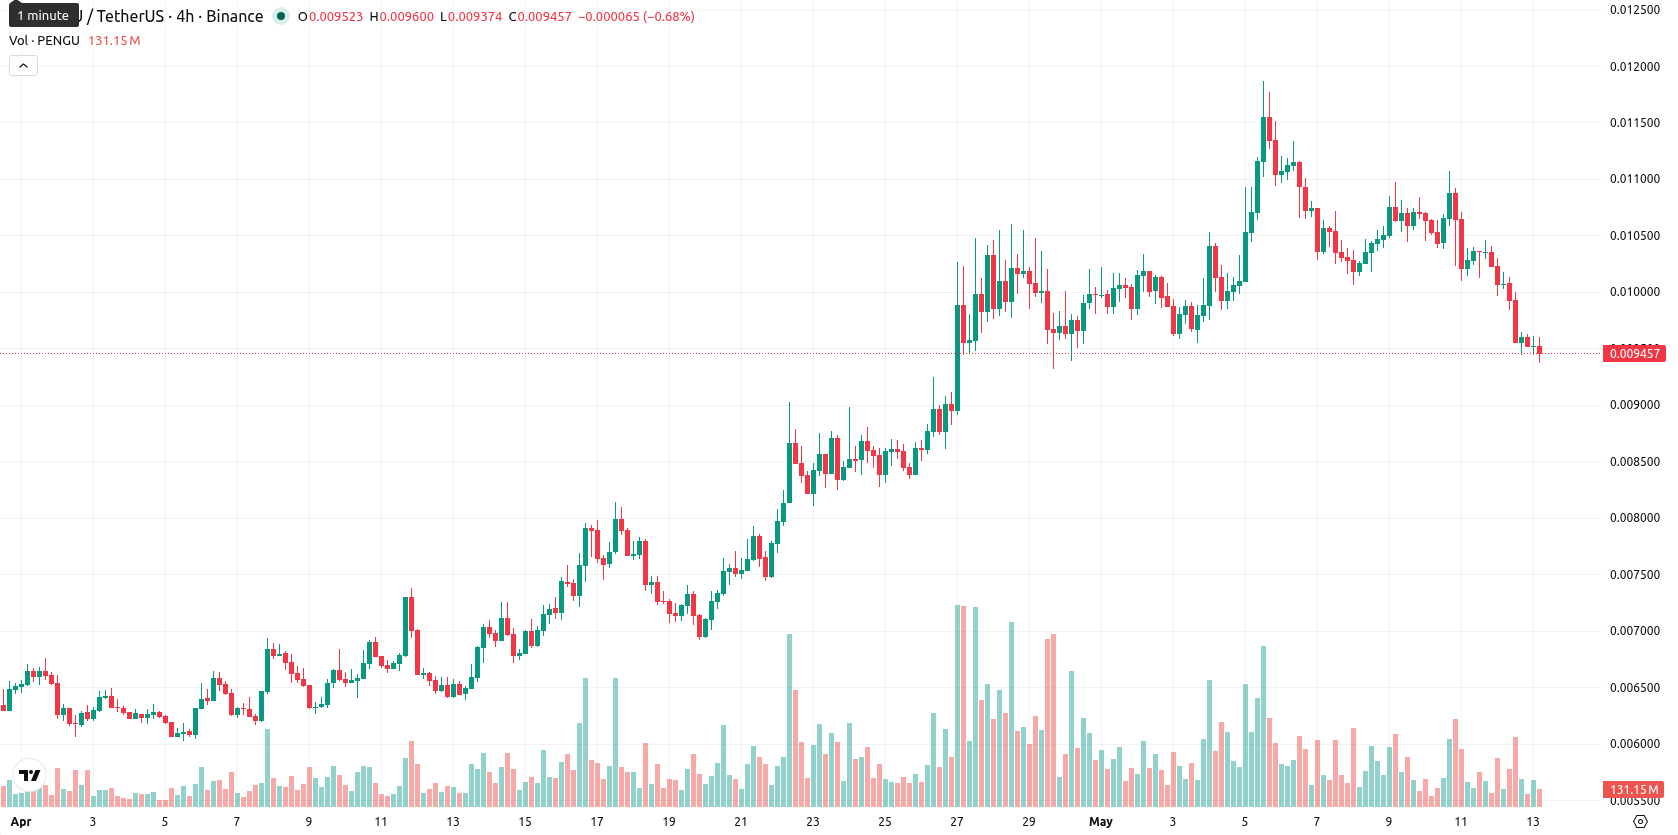
Pudgy Penguins (PENGU) is trading at $0.00943 after a 7.06% drop today. The asset sits just below its key moving averages in the short and long term, yet remains above the intermediate average.
 0.00628
0.00637
0.00628
0.00637
Highlights
- PENGU faces sustained short-term selling pressure after a 7% decline, with price action remaining weak and volatile.
- Momentum indicators are mixed—MACD shows strong buy interest, but Stoch RSI is deeply oversold and intraday selling persists.
- Trading is likely to consolidate between $0.00900 and $0.00980, with downside risk prevailing and a sub-20% chance of reversal higher.
Momentum divergence emerges as support holds against persistent selling
Technical levels for PENGU currently include the MA-20 at $0.00990, the MA-200 at $0.00976, and the MA-50 at $0.00807. The Ichimoku Kijun on the D1 timeframe registers at $0.00939, providing immediate support. On the daily chart, MACD indicates strong buy momentum and ADX remains supportive, while the Stoch RSI is deeply oversold and the RSI is in the mid-50s, pointing to a potential inflection. The CCI is neutral, BBP reflects mild buyer dominance, and the Awesome Oscillator is neutral, all against a backdrop of persistent intraday selling.
Limited upside seen as volatility constrains price direction
For the next five sessions, the typical volatility band is expected to range between $0.00900 and $0.00980. With none of the key weekly momentum indicators signaling bullishness, the probability of an upward move remains minimal, favoring continued downside or consolidation. The baseline scenario is a sideways trend within this corridor. A break above $0.00980 could trigger a recovery move toward nearby resistance, while a move below $0.00939 would open up rapid downside targeting the $0.00900 area.
Earlier, analysts noted that Pudgy Penguins maintained bullish momentum but faced resistance that could limit further gains. The current shift below key moving averages and increased selling pressure now highlight downside risks, making a sustained hold above $0.00939 essential for traders monitoring further weakness or potential stabilization.








-
 Afghanistan
-
 Albania
-
 Algeria
-
 Angola
-
 Argentina
-
 Armenia
-
 Australia
-
 Austria
-
 Azerbaijan
-
 Bahamas
-
 Bahrain
-
 Bangladesh
-
 Belarus
-
 Belgium
-
 Bolivia
-
 Botswana
-
 Brazil
-
 Brunei
-
 Bulgaria
-
 Cambodia
-
 Cameroon
-
 Canada
-
 Chile
Chile
-
 China
China
-
 Colombia
-
 Congo
Congo
-
 Costa Rica
-
 Cote d'Ivoire
-
 Croatia
-
 Cuba
Cuba
-
 Cyprus
-
 Czechia
-
 DR Congo
-
 Denmark
-
 Dominican Republic
-
 Ecuador
-
 Egypt
Egypt
-
 El Salvador
-
 Estonia
-
 Eswatini
-
 Ethiopia
-
 Finland
-
 France
-
 Georgia
-
 Germany
-
 Ghana
Ghana
-
 Greece
-
 Haiti
Haiti
-
 Hong Kong
-
 Hungary
-
 India
India
-
 Indonesia
-
 Iran, Islamic republic
-
 Iraq
Iraq
-
 Ireland
-
 Israel
-
 Italy
Italy
-
 Jamaica
-
 Japan
Japan
-
 Jordan
-
 Kazakhstan
-
 Kenya
Kenya
-
 Korea
Korea
-
 Kuwait
-
 Kyrgyzstan
-
 Laos
Laos
-
 Latvia
-
 Lebanon
-
 Lesotho
-
 Libya
Libya
-
 Lithuania
-
 Luxembourg
-
 Madagascar
-
 Malaysia
-
 Malta
Malta
-
 Mauritius
-
 Mexico
-
 Moldova
-
 Mongolia
-
 Montenegro
-
 Morocco
-
 Mozambique
-
 Myanmar
-
 Namibia
-
 Nepal
Nepal
-
 Netherlands
-
 New Zealand
-
 Nigeria
-
 North Macedonia
-
 Norway
-
 Oman
Oman
-
 Pakistan
-
 Palestine
-
 Panama
-
 Papua New Guinea
-
 Paraguay
-
 Peru
Peru
-
 Philippines
-
 Poland
-
 Portugal
-
 Puerto Rico
-
 Qatar
Qatar
-
 Reunion
-
 Romania
-
 Rwanda
-
 Saudi Arabia
-
 Serbia
-
 Singapore
-
 Slovakia
-
 Slovenia
-
 Somalia
-
 South Africa
-
 Spain
Spain
-
 Sri Lanka
-
 Sweden
-
 Switzerland
-
 Syria
Syria
-
 Taiwan
-
 Tajikistan
-
 Tanzania
-
 Thailand
-
 Trinidad and Tobago
-
 Tunisia
-
 Turkey
-
 UAE
UAE
-
 Uganda
-
 Ukraine
-
 United Kingdom
-
United States
-
 Uruguay
-
 Uzbekistan
-
 Venezuela
-
 Vietnam
-
 Yemen
Yemen
-
 Zambia
-
 Zimbabwe
- Forex
- Crypto











