
Bitcoin heads lower with RSI indicating selling conditions: weekly report

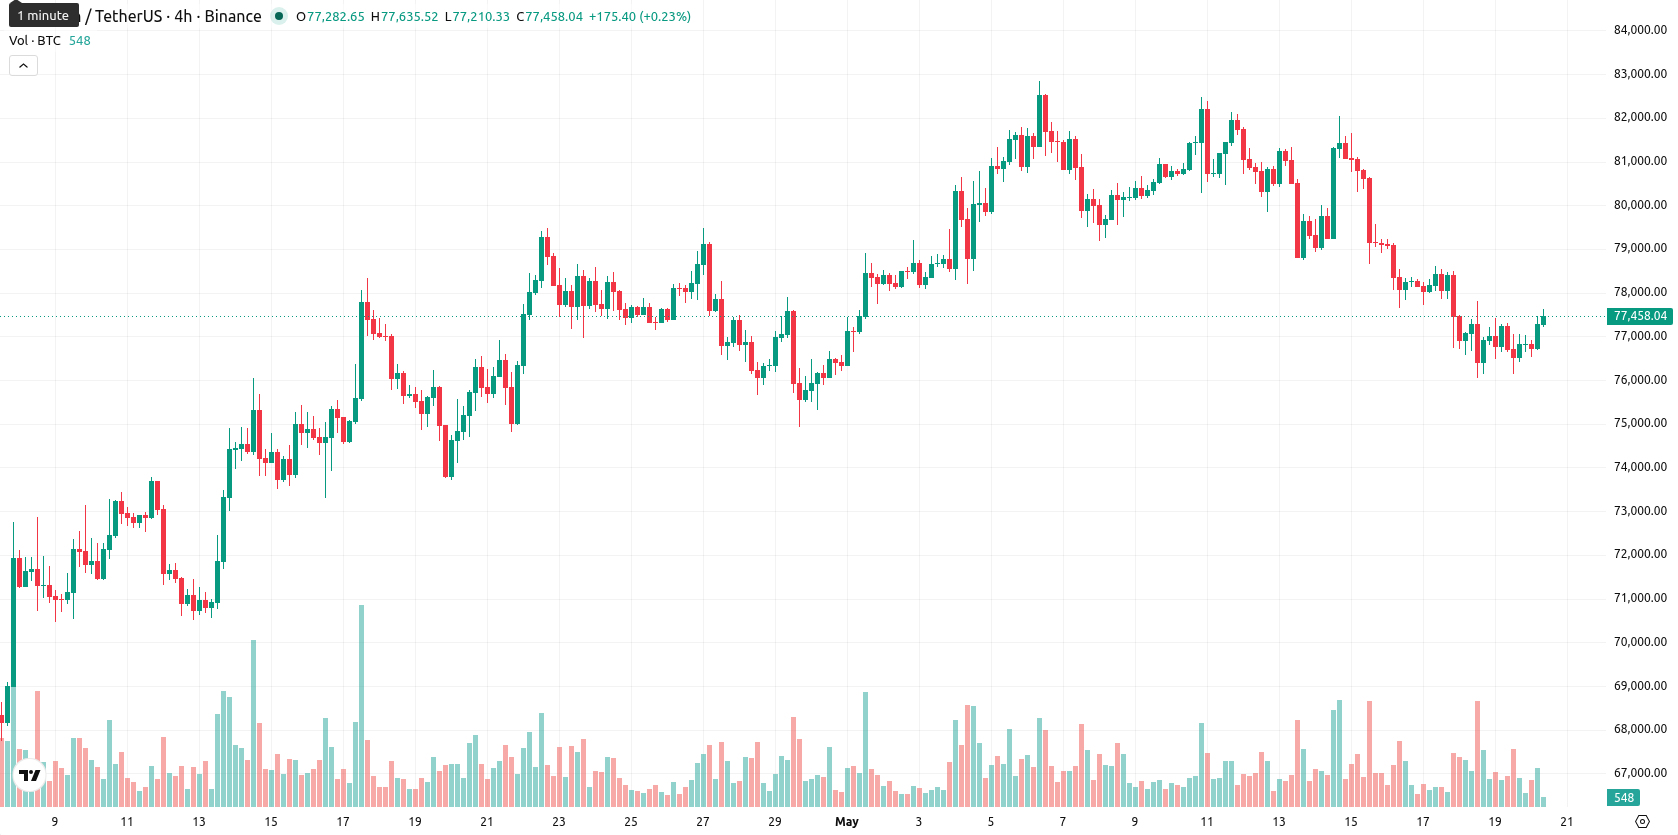
Bitcoin (BTC) ended the week with a loss of $3,678.61, down 4.51% from the previous week. The asset is currently positioned above its weekly MA-20 ($75,038.11), below the MA-50 ($94,043.29), and remains safely above the MA-200 ($61,372.65), showing medium-term resistance and strong longer-term support.
Highlights
- Bitcoin trades within a bearish weekly tone, having declined 4.51% and remaining in the lower end of its recent range.
- Momentum signals and oscillators confirm weak trend strength and persistent selling pressure, with no clear overbought or oversold extremes.
- Price is expected to consolidate between $76,000 and $81,100 over the next week; a breakdown below $76,000 would increase downside risk.
Institutional outflows spike as macro headwinds and ETF withdrawals weigh
Spot Bitcoin ETFs in the U.S. saw significant net outflows, with as much as $648 million to $1 billion withdrawn in a single day, breaking a prior six-week streak of inflows. The ETF outflows are occurring alongside macroeconomic headwinds, such as higher U.S. inflation and rising Treasury yields, putting pressure on institutional demand. Despite this, long-term holders are reportedly accumulating, and Bitcoin funding rates turned positive after months of negative figures. On the regulatory side, Thailand's SEC is accelerating plans to launch spot Bitcoin ETFs and expand digital asset opportunities.
Bearish technical bias persists amid mixed momentum and weak trend signals
Weekly technical signals are still biased to the downside. Bitcoin remains above the MA-20 but below the MA-50, with the Ichimoku Kijun ($78,962.25) acting as near-term resistance. The MACD on the weekly chart shows a strong sell signal and the ADX confirms no strong trend, while oscillators are mixed: RSI signals selling, Stochastic RSI and CCI are neutral, and Bull/Bear Power still favors buyers. The Awesome Oscillator does not confirm a trend, and volatility stands at 7.89%. Support is at $76,000, with resistance at $81,100 based on the current weekly range.
Consolidation expected this week as breakout odds remain limited
Over the next 7 days, Bitcoin is likely to consolidate within the $76,000 to $81,100 range. With none of the major weekly indicators providing a buy signal, and short- and medium-term momentum remaining negative, a breakout above resistance is unlikely, with less than 20% probability. The baseline scenario is further sideways trading, but if $81,100 is cleared, there could be a move toward the next resistance. Conversely, a break below $76,000 would put additional pressure on support and could trigger further downside.
Earlier, analysts noted that Bitcoin’s performance often tracks shifts in U.S. dollar strength, with a weaker dollar historically providing a more favorable backdrop for crypto assets. In the current environment, renewed macroeconomic pressure and ETF outflows reinforce a cautious outlook, and traders should closely monitor the $76,000 support as a potential trigger for additional downside risk.


-
 Afghanistan
-
 Albania
-
 Algeria
-
 Angola
-
 Argentina
-
 Armenia
-
 Australia
-
 Austria
-
 Azerbaijan
-
 Bahamas
-
 Bahrain
-
 Bangladesh
-
 Belarus
-
 Belgium
-
 Bolivia
-
 Botswana
-
 Brazil
-
 Brunei
-
 Bulgaria
-
 Cambodia
-
 Cameroon
-
 Canada
-
 Chile
Chile
-
 China
China
-
 Colombia
-
 Congo
Congo
-
 Costa Rica
-
 Cote d'Ivoire
-
 Croatia
-
 Cuba
Cuba
-
 Cyprus
-
 Czechia
-
 DR Congo
-
 Denmark
-
 Dominican Republic
-
 Ecuador
-
 Egypt
Egypt
-
 El Salvador
-
 Estonia
-
 Eswatini
-
 Ethiopia
-
 Finland
-
 France
-
 Georgia
-
 Germany
-
 Ghana
Ghana
-
 Greece
-
 Haiti
Haiti
-
 Hong Kong
-
 Hungary
-
 India
India
-
 Indonesia
-
 Iran, Islamic republic
-
 Iraq
Iraq
-
 Ireland
-
 Israel
-
 Italy
Italy
-
 Jamaica
-
 Japan
Japan
-
 Jordan
-
 Kazakhstan
-
 Kenya
Kenya
-
 Korea
Korea
-
 Kuwait
-
 Kyrgyzstan
-
 Laos
Laos
-
 Latvia
-
 Lebanon
-
 Lesotho
-
 Libya
Libya
-
 Lithuania
-
 Luxembourg
-
 Madagascar
-
 Malaysia
-
 Malta
Malta
-
 Mauritius
-
 Mexico
-
 Moldova
-
 Mongolia
-
 Montenegro
-
 Morocco
-
 Mozambique
-
 Myanmar
-
 Namibia
-
 Nepal
Nepal
-
 Netherlands
-
 New Zealand
-
 Nigeria
-
 North Macedonia
-
 Norway
-
 Oman
Oman
-
 Pakistan
-
 Palestine
-
 Panama
-
 Papua New Guinea
-
 Paraguay
-
 Peru
Peru
-
 Philippines
-
 Poland
-
 Portugal
-
 Puerto Rico
-
 Qatar
Qatar
-
 Reunion
-
 Romania
-
 Rwanda
-
 Saudi Arabia
-
 Serbia
-
 Singapore
-
 Slovakia
-
 Slovenia
-
 Somalia
-
 South Africa
-
 Spain
Spain
-
 Sri Lanka
-
 Sweden
-
 Switzerland
-
 Syria
Syria
-
 Taiwan
-
 Tajikistan
-
 Tanzania
-
 Thailand
-
 Trinidad and Tobago
-
 Tunisia
-
 Turkey
-
 UAE
UAE
-
 Uganda
-
 Ukraine
-
 United Kingdom
-
United States
-
 Uruguay
-
 Uzbekistan
-
 Venezuela
-
 Vietnam
-
 Yemen
Yemen
-
 Zambia
-
 Zimbabwe
- Forex
- Crypto
