
Cosmos falls 7.05% as trading stays well below long-term average

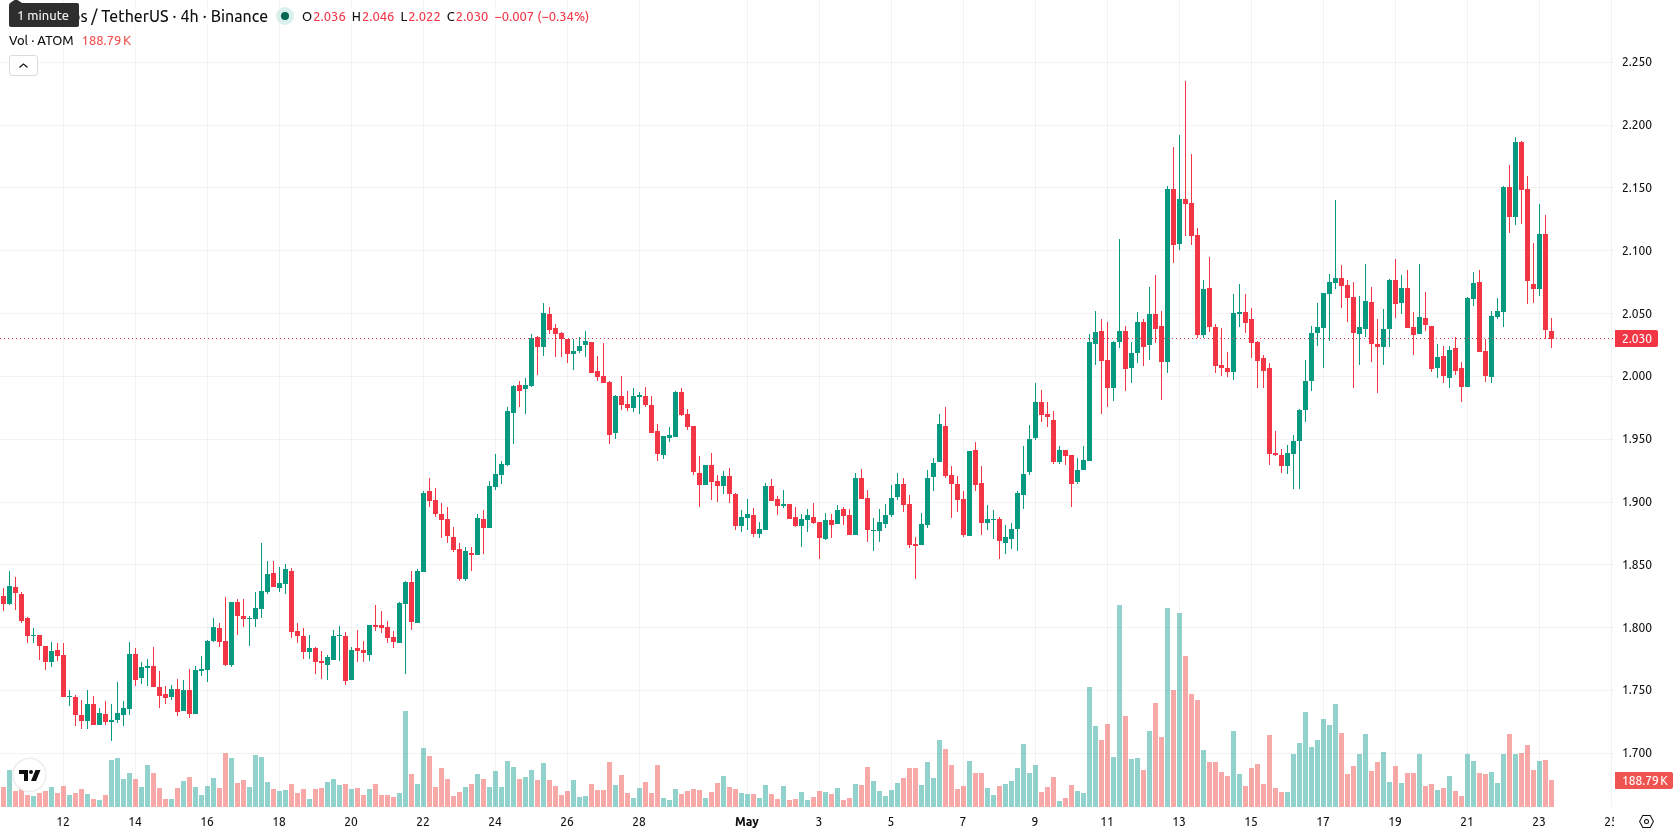
Cosmos (ATOM) is trading at $2.031, marking a daily decline of 7.05%. The token remains above its key short- and medium-term moving averages, while trading just below the long-term average.
 1.499
1.5940000
1.499
1.5940000
Highlights
- ATOM staking activity remains robust as validators and delegators lock tokens, restricting circulating supply and incentivizing holding.
- Coinbase accumulation suggests shifting liquidity, but overall market pressure persists, keeping ATOM's price subdued amid ongoing selling.
- Technical outlook signals mixed short- and medium-term momentum, with likely sideways trading in a $1.90–$2.15 range and low probability of upside breakout.
Staking incentives and Coinbase accumulation temper sell-side liquidity
Validators have continued to secure the Cosmos network by staking ATOM, which increases the number of tokens locked and may limit the freely tradable supply in the market. In parallel, delegators remain able to participate in network security and earn staking rewards by delegating their ATOM tokens, creating ongoing incentives for token holders to keep their assets staked rather than liquid. Recent accumulation of ATOM on Coinbase was reported and may reflect shifting short-term liquidity, though price action has remained under broader selling pressure.
Mixed momentum contrasts resistance at long-term technical barriers
Technical analysis reveals that ATOM is trading above the SMA-20 at $1.9900 and the SMA-50 at $1.8949, but remains below the SMA-200 set at $2.1132, which continues to function as resistance. The Ichimoku Kijun is positioned at $2.0365, immediately above price and marking the next resistance level. The daily chart shows a mixed momentum picture: the MACD provides a Strong Buy signal, and the ADX at 21.09 points to a modest trend, while the RSI at 58.7 and CCI at 110 indicate slightly overbought conditions. The Stoch RSI is neutral, BBP signals a marginal advantage to buyers intraday, and the Awesome Oscillator suggests a positive bias, though high intraday volatility and selling pressure have resulted in ATOM trading near intraday lows. Divergence among momentum and oscillator indicators is notable, with strong momentum not fully translating into upward price movement.
Downside risk elevated as indicators reinforce sideways outlook
Over the next five trading days, ATOM is expected to remain within a $1.85–$2.20 volatility band relative to current levels, reflecting recent sharp moves. Downside risk is heightened, with a less than 20% probability of upward price movement based on current weekly indicator signals, all of which display Sell or Strong Sell classifications. The baseline scenario is for sideways consolidation within the $1.90–$2.15 range. A bullish break above $2.04–$2.05 could target the $2.18–$2.20 area, while a breakdown below $2.02 may test support near $1.85.
Earlier, analysts noted that Cosmos was exhibiting cautious upward momentum but faced lingering downside risks amid overextension concerns. The latest data underscores growing divergence among technical indicators and sustained selling pressure, highlighting that a decisive break below $2.02 could deepen losses toward $1.85 in the sessions ahead.








-
 Afghanistan
-
 Albania
-
 Algeria
-
 Angola
-
 Argentina
-
 Armenia
-
 Australia
-
 Austria
-
 Azerbaijan
-
 Bahamas
-
 Bahrain
-
 Bangladesh
-
 Belarus
-
 Belgium
-
 Bolivia
-
 Botswana
-
 Brazil
-
 Brunei
-
 Bulgaria
-
 Cambodia
-
 Cameroon
-
 Canada
-
 Chile
Chile
-
 China
China
-
 Colombia
-
 Congo
Congo
-
 Costa Rica
-
 Cote d'Ivoire
-
 Croatia
-
 Cuba
Cuba
-
 Cyprus
-
 Czechia
-
 DR Congo
-
 Denmark
-
 Dominican Republic
-
 Ecuador
-
 Egypt
Egypt
-
 El Salvador
-
 Estonia
-
 Eswatini
-
 Ethiopia
-
 Finland
-
 France
-
 Georgia
-
 Germany
-
 Ghana
Ghana
-
 Greece
-
 Haiti
Haiti
-
 Hong Kong
-
 Hungary
-
 India
India
-
 Indonesia
-
 Iran, Islamic republic
-
 Iraq
Iraq
-
 Ireland
-
 Israel
-
 Italy
Italy
-
 Jamaica
-
 Japan
Japan
-
 Jordan
-
 Kazakhstan
-
 Kenya
Kenya
-
 Korea
Korea
-
 Kuwait
-
 Kyrgyzstan
-
 Laos
Laos
-
 Latvia
-
 Lebanon
-
 Lesotho
-
 Libya
Libya
-
 Lithuania
-
 Luxembourg
-
 Madagascar
-
 Malaysia
-
 Malta
Malta
-
 Mauritius
-
 Mexico
-
 Moldova
-
 Mongolia
-
 Montenegro
-
 Morocco
-
 Mozambique
-
 Myanmar
-
 Namibia
-
 Nepal
Nepal
-
 Netherlands
-
 New Zealand
-
 Nigeria
-
 North Macedonia
-
 Norway
-
 Oman
Oman
-
 Pakistan
-
 Palestine
-
 Panama
-
 Papua New Guinea
-
 Paraguay
-
 Peru
Peru
-
 Philippines
-
 Poland
-
 Portugal
-
 Puerto Rico
-
 Qatar
Qatar
-
 Reunion
-
 Romania
-
 Rwanda
-
 Saudi Arabia
-
 Serbia
-
 Singapore
-
 Slovakia
-
 Slovenia
-
 Somalia
-
 South Africa
-
 Spain
Spain
-
 Sri Lanka
-
 Sweden
-
 Switzerland
-
 Syria
Syria
-
 Taiwan
-
 Tajikistan
-
 Tanzania
-
 Thailand
-
 Trinidad and Tobago
-
 Tunisia
-
 Turkey
-
 UAE
UAE
-
 Uganda
-
 Ukraine
-
 United Kingdom
-
United States
-
 Uruguay
-
 Uzbekistan
-
 Venezuela
-
 Vietnam
-
 Yemen
Yemen
-
 Zambia
-
 Zimbabwe
- Forex
- Crypto











