

+7.29% for Tezos as buying momentum pauses below the $0.3500 resistance

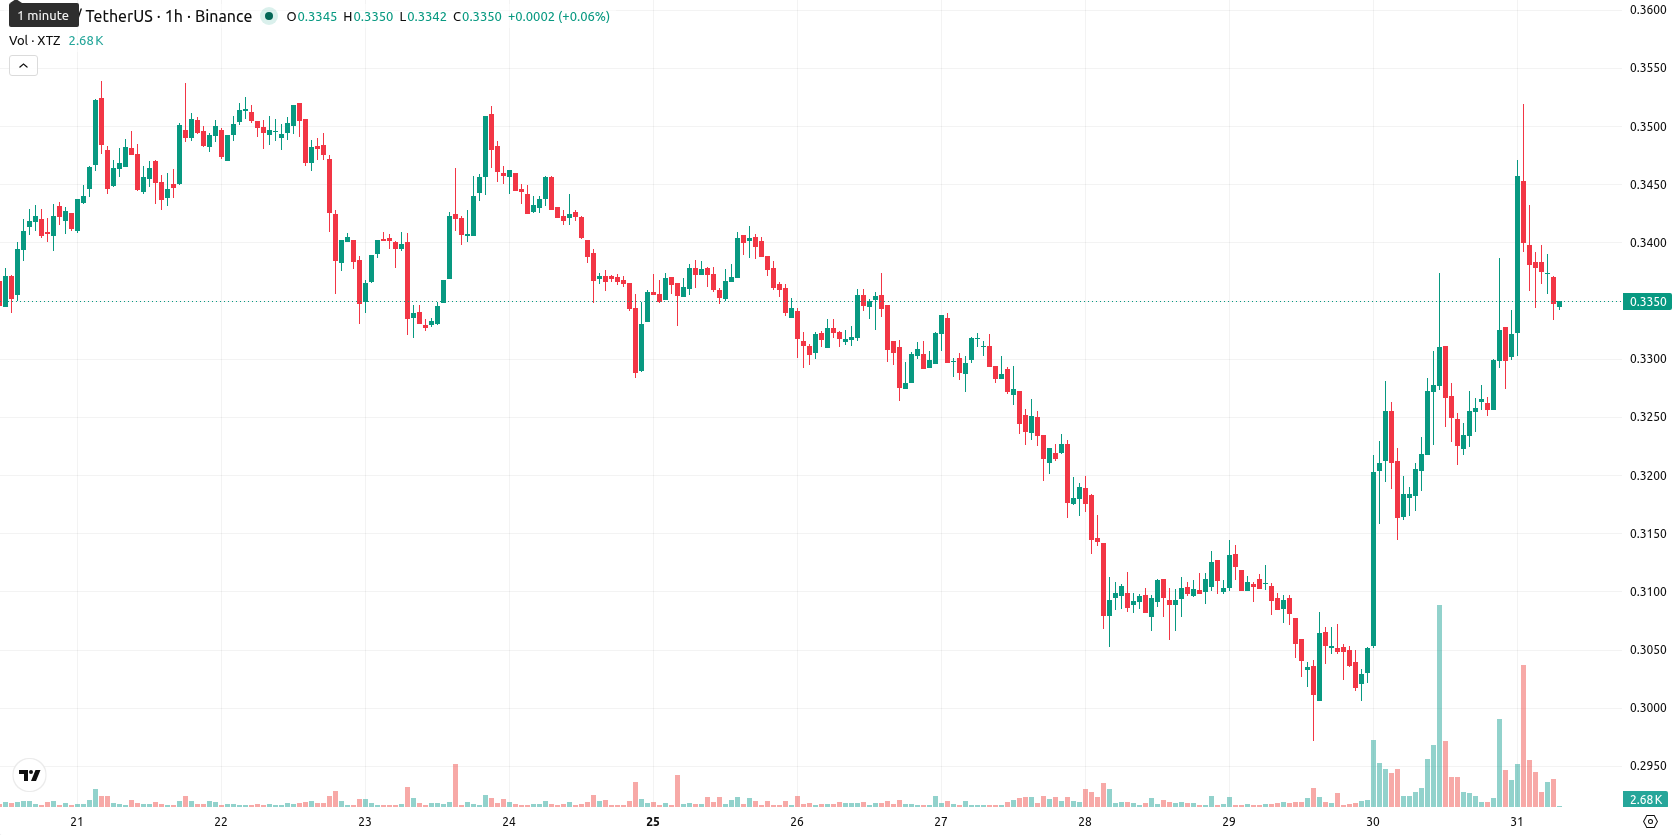
Tezos (XTZ) is trading at $0.3339, marking a sharp daily gain of 7.29%. The asset remains below its key moving averages, indicating persistent headwinds despite today's upward move.
 0.3032
0.35210000
0.3032
0.35210000
Highlights
- XTZ trades below key moving averages across all timeframes, confirming persistent downside pressure and seller control.
- Intraday volatility is high, as a sharp 7% rebound faces resistance and fails to reverse the broader weak trend.
- Price is expected to consolidate between $0.3150 and $0.3550 over five days, with over 80% probability of further decline.
Resistance clusters test buyer momentum amid broad technical weakness
On the technical front, XTZ faces resistance from the SMA-20 at $0.3457, SMA-50 at $0.3603, and SMA-200 at $0.4335, with the Ichimoku Kijun level at $0.3500 acting as immediate overhead resistance. The daily chart reveals mixed momentum signals: MACD and ADX are signaling 'Sell', while RSI at 44.2 and CCI at -81.1 rule out oversold conditions but point to underlying weakness. Stoch RSI is overbought, highlighting stretched near-term buying, whereas intraday indicators such as BBP and HMA suggest recent buyer momentum. The Awesome Oscillator remains negative. After opening with a moderate gap up from $0.3112 to $0.3297, price action is fluctuating near the mid-range of the day ($0.3271–$0.3519), reflecting heightened volatility and a notable divergence between brief buyer activity and the broader downtrend.
Downside risk dominates as bearish signals fuel consolidation outlook
Looking ahead to the next five trading days, XTZ is expected to move within a $0.3150–$0.3550 price corridor, consistent with recent volatility around current levels. Downside risk dominates, with an 80%+ probability of further declines given persistent bearish readings from the weekly moving averages, RSI, and MACD. The baseline view is for a sideways consolidation between near-term support and resistance levels, with a clear push above the Kijun ($0.3500) required to signal bullish momentum. A break below $0.3150 could open up further losses, while upside is capped barring a reversal in current technical patterns.
Earlier, analysts noted that Tezos remained under sustained bearish pressure with limited signs of an immediate reversal. Fresh technical data from this session reinforce the cautious outlook, suggesting that a convincing break above the $0.3500 Ichimoku Kijun level remains the key trigger to watch for any shift toward bullish momentum in the days ahead.





Latest Tezos News






-
 Afghanistan
-
 Albania
-
 Algeria
-
 Angola
-
 Argentina
-
 Armenia
-
 Australia
-
 Austria
-
 Azerbaijan
-
 Bahamas
-
 Bahrain
-
 Bangladesh
-
 Belarus
-
 Belgium
-
 Bolivia
-
 Botswana
-
 Brazil
-
 Brunei
-
 Bulgaria
-
 Cambodia
-
 Cameroon
-
 Canada
-
 Chile
Chile
-
 China
China
-
 Colombia
-
 Congo
Congo
-
 Costa Rica
-
 Cote d'Ivoire
-
 Croatia
-
 Cuba
Cuba
-
 Cyprus
-
 Czechia
-
 DR Congo
-
 Denmark
-
 Dominican Republic
-
 Ecuador
-
 Egypt
Egypt
-
 El Salvador
-
 Estonia
-
 Eswatini
-
 Ethiopia
-
 Finland
-
 France
-
 Georgia
-
 Germany
-
 Ghana
Ghana
-
 Greece
-
 Haiti
Haiti
-
 Hong Kong
-
 Hungary
-
 India
India
-
 Indonesia
-
 Iran, Islamic republic
-
 Iraq
Iraq
-
 Ireland
-
 Israel
-
 Italy
Italy
-
 Jamaica
-
 Japan
Japan
-
 Jordan
-
 Kazakhstan
-
 Kenya
Kenya
-
 Korea
Korea
-
 Kuwait
-
 Kyrgyzstan
-
 Laos
Laos
-
 Latvia
-
 Lebanon
-
 Lesotho
-
 Libya
Libya
-
 Lithuania
-
 Luxembourg
-
 Madagascar
-
 Malaysia
-
 Malta
Malta
-
 Mauritius
-
 Mexico
-
 Moldova
-
 Mongolia
-
 Montenegro
-
 Morocco
-
 Mozambique
-
 Myanmar
-
 Namibia
-
 Nepal
Nepal
-
 Netherlands
-
 New Zealand
-
 Nigeria
-
 North Macedonia
-
 Norway
-
 Oman
Oman
-
 Pakistan
-
 Palestine
-
 Panama
-
 Papua New Guinea
-
 Paraguay
-
 Peru
Peru
-
 Philippines
-
 Poland
-
 Portugal
-
 Puerto Rico
-
 Qatar
Qatar
-
 Reunion
-
 Romania
-
 Rwanda
-
 Saudi Arabia
-
 Serbia
-
 Singapore
-
 Slovakia
-
 Slovenia
-
 Somalia
-
 South Africa
-
 Spain
Spain
-
 Sri Lanka
-
 Sweden
-
 Switzerland
-
 Syria
Syria
-
 Taiwan
-
 Tajikistan
-
 Tanzania
-
 Thailand
-
 Trinidad and Tobago
-
 Tunisia
-
 Turkey
-
 UAE
UAE
-
 Uganda
-
 Ukraine
-
 United Kingdom
-
United States
-
 Uruguay
-
 Uzbekistan
-
 Venezuela
-
 Vietnam
-
 Yemen
Yemen
-
 Zambia
-
 Zimbabwe
- Forex
- Crypto












