
Render price prediction: Will $2.23 resistance hold as RNDR jumps 9.27%?

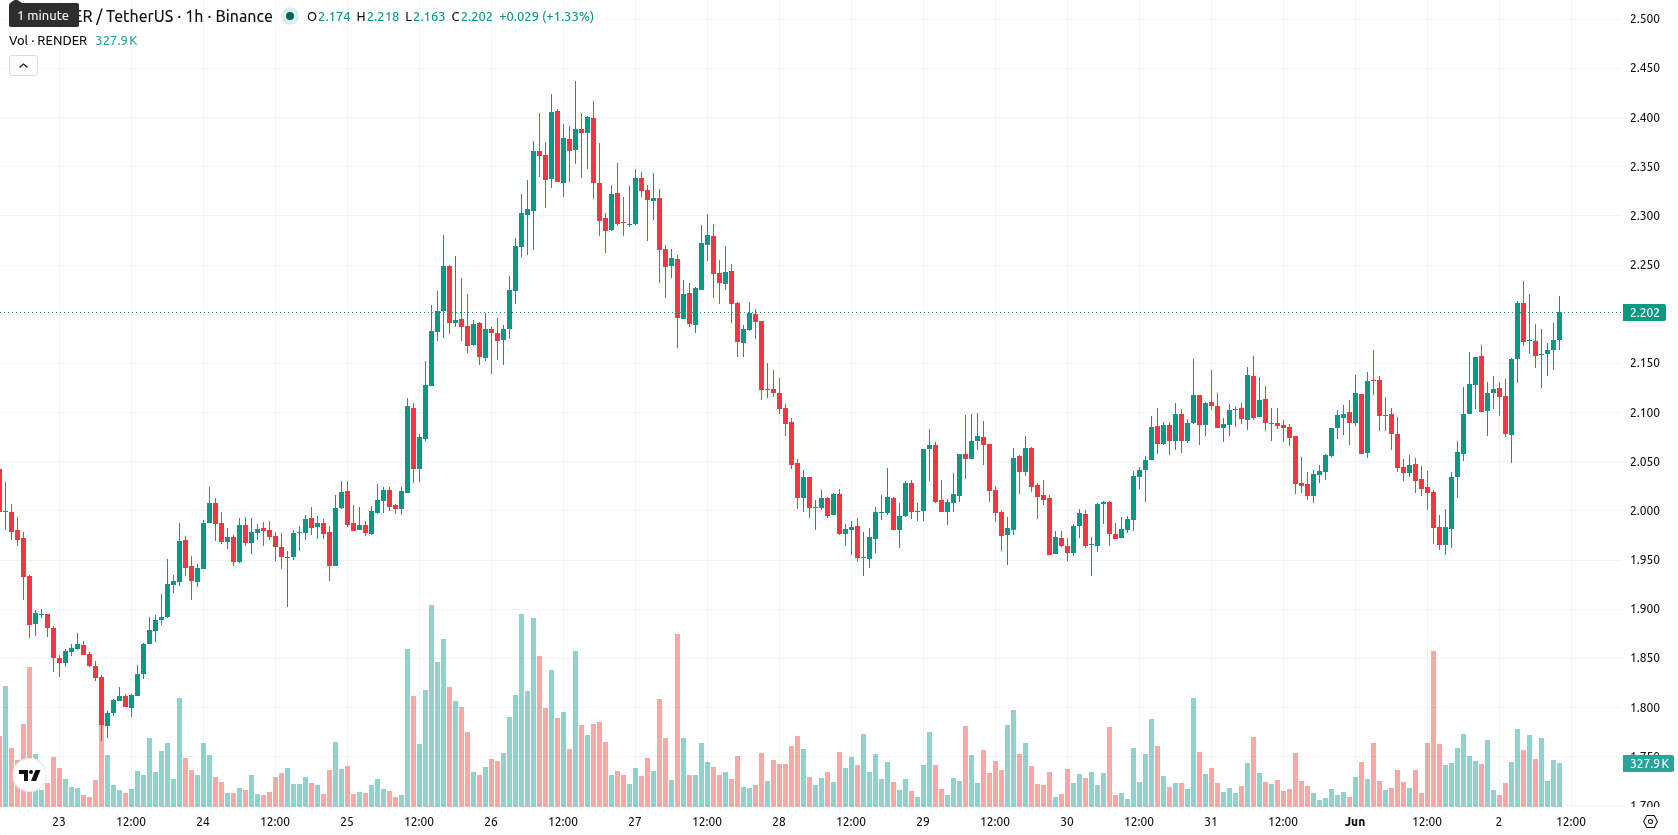
Render (RENDER) is trading at $2.217, up 9.27% on the day and holding well above its key moving averages. The asset sits in a strong technical position relative to recent averages.
Highlights
- Render maintains a clear bullish trend across all timeframes, with price well above key moving averages.
- Momentum indicators confirm persistent buying interest, strong intraday advances, and no definitive overbought warning yet.
- Expected five-session trading range is $2.11–$2.33, with consolidation favored unless price breaks above $2.23 or below $2.11.
Bullish signals as decisive breakout joins strong momentum
On the technical front, $2.217 stands decisively above the MA-20 at $1.9719, MA-50 at $1.8947, and MA-200 at $1.7386, representing a clean breakout across all periods. The Ichimoku Kijun level at $2.0845 is a key support threshold. Daily chart indicators are constructive, with both MACD and ADX signaling bullish momentum. RSI registers a neutral 57.51, Stoch RSI sits at 43.29, and CCI reads 63.78, indicating the absence of overbought warnings on the daily timeframe, though short-term readings hint at minor froth. Bull/Bear Power (BBP) is highly positive, illustrating buyer dominance, while the price remains close to today's session high at $2.233 with high volatility and momentum confirmed by intraday action.
Limited upside as consolidation risk dominates price outlook
For the next five sessions, the anticipated price corridor ranges from $2.11 to $2.33, marking the typical volatility band relative to current levels. Given that weekly MACD and MA-50 signals suggest only a slim chance (under 20%) of further price appreciation, price action is more likely to consolidate within this range. A confirmed break above $2.23 could unlock additional upside, while a sustained drop below $2.11 may prompt renewed seller activity and a deeper correction.
Earlier, analysts noted that Render was exhibiting sustained bullish momentum but recommended caution as consolidation was the likely scenario. The latest breakout and strength in technical indicators reinforce this outlook, suggesting traders should closely monitor the $2.23 level for potential upside while staying alert to heightened volatility within the $2.11–$2.33 range.


-
 Afghanistan
-
 Albania
-
 Algeria
-
 Angola
-
 Argentina
-
 Armenia
-
 Australia
-
 Austria
-
 Azerbaijan
-
 Bahamas
-
 Bahrain
-
 Bangladesh
-
 Belarus
-
 Belgium
-
 Bolivia
-
 Botswana
-
 Brazil
-
 Brunei
-
 Bulgaria
-
 Cambodia
-
 Cameroon
-
 Canada
-
 Chile
Chile
-
 China
China
-
 Colombia
-
 Congo
Congo
-
 Costa Rica
-
 Cote d'Ivoire
-
 Croatia
-
 Cuba
Cuba
-
 Cyprus
-
 Czechia
-
 DR Congo
-
 Denmark
-
 Dominican Republic
-
 Ecuador
-
 Egypt
Egypt
-
 El Salvador
-
 Estonia
-
 Eswatini
-
 Ethiopia
-
 Finland
-
 France
-
 Georgia
-
 Germany
-
 Ghana
Ghana
-
 Greece
-
 Haiti
Haiti
-
 Hong Kong
-
 Hungary
-
 India
India
-
 Indonesia
-
 Iran, Islamic republic
-
 Iraq
Iraq
-
 Ireland
-
 Israel
-
 Italy
Italy
-
 Jamaica
-
 Japan
Japan
-
 Jordan
-
 Kazakhstan
-
 Kenya
Kenya
-
 Korea
Korea
-
 Kuwait
-
 Kyrgyzstan
-
 Laos
Laos
-
 Latvia
-
 Lebanon
-
 Lesotho
-
 Libya
Libya
-
 Lithuania
-
 Luxembourg
-
 Madagascar
-
 Malaysia
-
 Malta
Malta
-
 Mauritius
-
 Mexico
-
 Moldova
-
 Mongolia
-
 Montenegro
-
 Morocco
-
 Mozambique
-
 Myanmar
-
 Namibia
-
 Nepal
Nepal
-
 Netherlands
-
 New Zealand
-
 Nigeria
-
 North Macedonia
-
 Norway
-
 Oman
Oman
-
 Pakistan
-
 Palestine
-
 Panama
-
 Papua New Guinea
-
 Paraguay
-
 Peru
Peru
-
 Philippines
-
 Poland
-
 Portugal
-
 Puerto Rico
-
 Qatar
Qatar
-
 Reunion
-
 Romania
-
 Rwanda
-
 Saudi Arabia
-
 Serbia
-
 Singapore
-
 Slovakia
-
 Slovenia
-
 Somalia
-
 South Africa
-
 Spain
Spain
-
 Sri Lanka
-
 Sweden
-
 Switzerland
-
 Syria
Syria
-
 Taiwan
-
 Tajikistan
-
 Tanzania
-
 Thailand
-
 Trinidad and Tobago
-
 Tunisia
-
 Turkey
-
 UAE
UAE
-
 Uganda
-
 Ukraine
-
 United Kingdom
-
United States
-
 Uruguay
-
 Uzbekistan
-
 Venezuela
-
 Vietnam
-
 Yemen
Yemen
-
 Zambia
-
 Zimbabwe
- Forex
- Crypto
