
Render shows mixed momentum as Stochastic RSI reaches oversold territory: weekly analysis

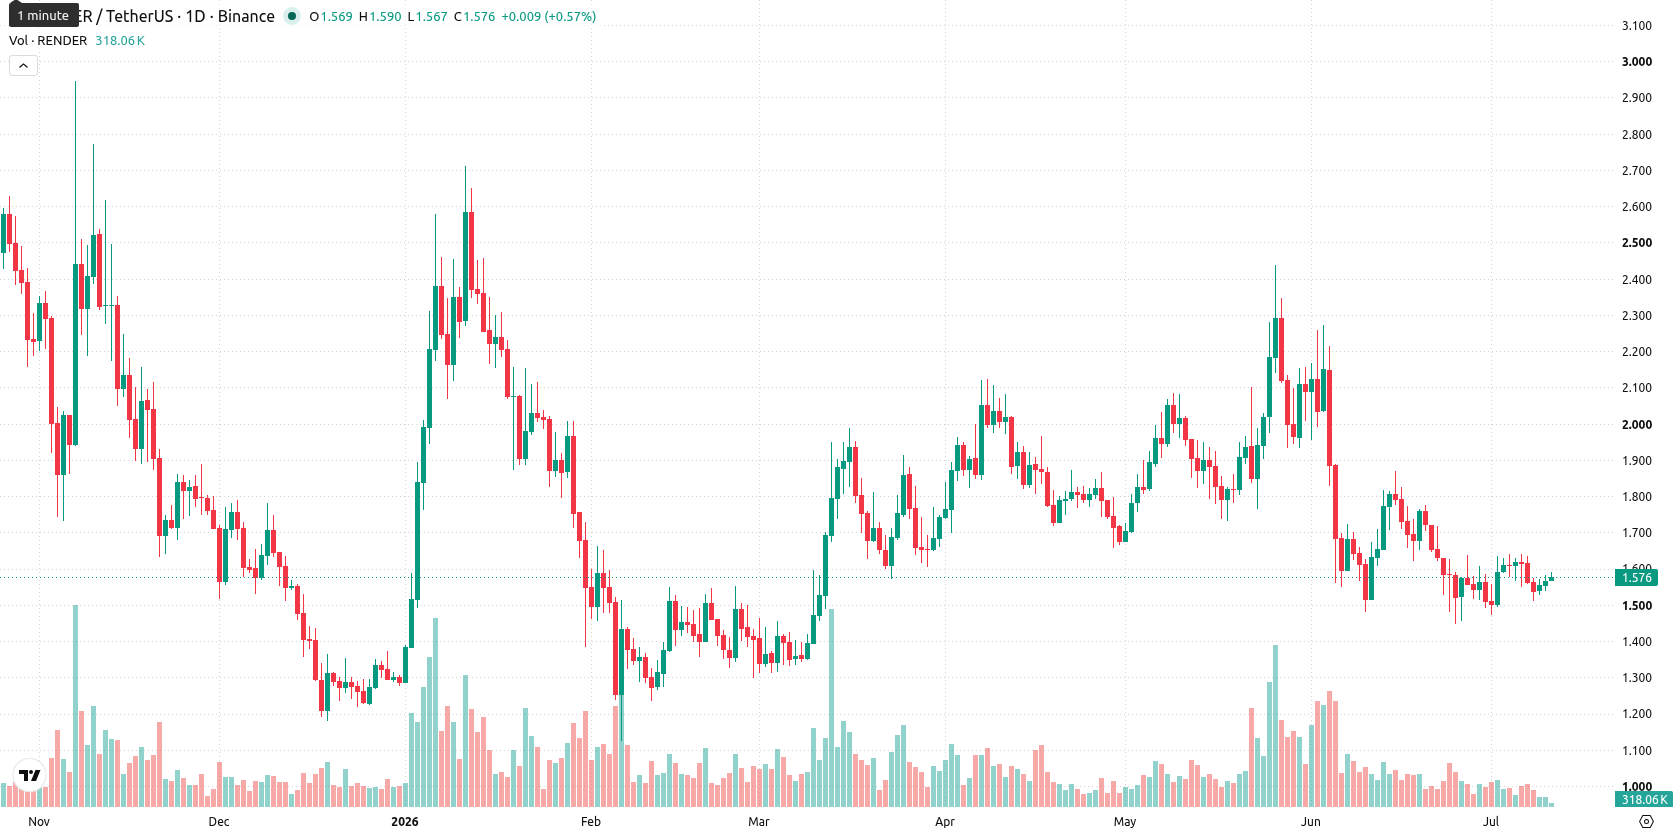
Render Network (RNDR) is currently trading at $1.576 after falling $0.017 (1.07%) over the last 7 days. The asset remains below both its weekly MA-20 of $1.7402 and MA-50 of $2.1903, highlighting sustained medium- and long-term selling pressure.
 1.59
1.6400
1.59
1.6400
Highlights
- Render remains under sustained selling pressure, trading below medium- and long-term trend indicators with a steady weekly decline.
- Momentum and volatility signals are bearish across most technical indicators, with sellers clearly dominating recent activity.
- Price is expected to consolidate between $1.45 and $1.71, with a low probability of upward breakout and risk of further downside if support breaks.
Bearish momentum prevails as indicators flash oversold signals
Weekly momentum on Render is weak, with the MACD showing a bearish reading and the ADX indicating a lack of trend strength. The RSI and Commodity Channel Index are both negative, signaling ongoing bearish momentum, while the Stochastic RSI is now deep in oversold territory, suggesting sellers may be showing exhaustion for the short term. The nearest dynamic resistance is at the MA-20 ($1.7402), while the key weekly price range is defined by support at $1.45 and resistance at $1.71. Bull/Bear Power is negative, confirming sellers' dominance of the weekly chart. Weekly volatility registers at 8.54%.
Sideways consolidation expected as technicals cap rebound risks
Over the next 7 days, Render is likely to consolidate between support at $1.45 and resistance at $1.71, barring any major external events. All weekly technical signals remain bearish, with less than a 20% probability of a significant upward move, given that none of the four core indicators are flashing a buy. The most probable scenario is continued sideways action near current prices. A decisive breakout above $1.71 would be needed to signal bullish reversal, while a sustained drop below $1.45 would confirm renewed selling pressure.
In a recent review, analysts highlighted sustained bearish momentum for Render, citing persistent selling pressure and weak technical signals. The current technical setup reinforces this outlook, suggesting traders should closely monitor the $1.45 support level as a potential trigger for renewed volatility.


Latest Render News






-
 Afghanistan
-
 Albania
-
 Algeria
-
 Angola
-
 Argentina
-
 Armenia
-
 Australia
-
 Austria
-
 Azerbaijan
-
 Bahamas
-
 Bahrain
-
 Bangladesh
-
 Belarus
-
 Belgium
-
 Bolivia
-
 Botswana
-
 Brazil
-
 Brunei
-
 Bulgaria
-
 Cambodia
-
 Cameroon
-
 Canada
-
 Chile
Chile
-
 China
China
-
 Colombia
-
 Congo
Congo
-
 Costa Rica
-
 Cote d'Ivoire
-
 Croatia
-
 Cuba
Cuba
-
 Cyprus
-
 Czechia
-
 DR Congo
-
 Denmark
-
 Dominican Republic
-
 Ecuador
-
 Egypt
Egypt
-
 El Salvador
-
 Estonia
-
 Eswatini
-
 Ethiopia
-
 Finland
-
 France
-
 Georgia
-
 Germany
-
 Ghana
Ghana
-
 Greece
-
 Haiti
Haiti
-
 Hong Kong
-
 Hungary
-
 India
India
-
 Indonesia
-
 Iran, Islamic republic
-
 Iraq
Iraq
-
 Ireland
-
 Israel
-
 Italy
Italy
-
 Jamaica
-
 Japan
Japan
-
 Jordan
-
 Kazakhstan
-
 Kenya
Kenya
-
 Korea
Korea
-
 Kuwait
-
 Kyrgyzstan
-
 Laos
Laos
-
 Latvia
-
 Lebanon
-
 Lesotho
-
 Libya
Libya
-
 Lithuania
-
 Luxembourg
-
 Madagascar
-
 Malaysia
-
 Malta
Malta
-
 Mauritius
-
 Mexico
-
 Moldova
-
 Mongolia
-
 Montenegro
-
 Morocco
-
 Mozambique
-
 Myanmar
-
 Namibia
-
 Nepal
Nepal
-
 Netherlands
-
 New Zealand
-
 Nigeria
-
 North Macedonia
-
 Norway
-
 Oman
Oman
-
 Pakistan
-
 Palestine
-
 Panama
-
 Papua New Guinea
-
 Paraguay
-
 Peru
Peru
-
 Philippines
-
 Poland
-
 Portugal
-
 Puerto Rico
-
 Qatar
Qatar
-
 Reunion
-
 Romania
-
 Rwanda
-
 Saudi Arabia
-
 Serbia
-
 Singapore
-
 Slovakia
-
 Slovenia
-
 Somalia
-
 South Africa
-
 Spain
Spain
-
 Sri Lanka
-
 Sweden
-
 Switzerland
-
 Syria
Syria
-
 Taiwan
-
 Tajikistan
-
 Tanzania
-
 Thailand
-
 Trinidad and Tobago
-
 Tunisia
-
 Turkey
-
 UAE
UAE
-
 Uganda
-
 Ukraine
-
 United Kingdom
-
United States
-
 Uruguay
-
 Uzbekistan
-
 Venezuela
-
 Vietnam
-
 Yemen
Yemen
-
 Zambia
-
 Zimbabwe
- Forex
- Crypto











