
Sei tumbles as price slips well below long-term average

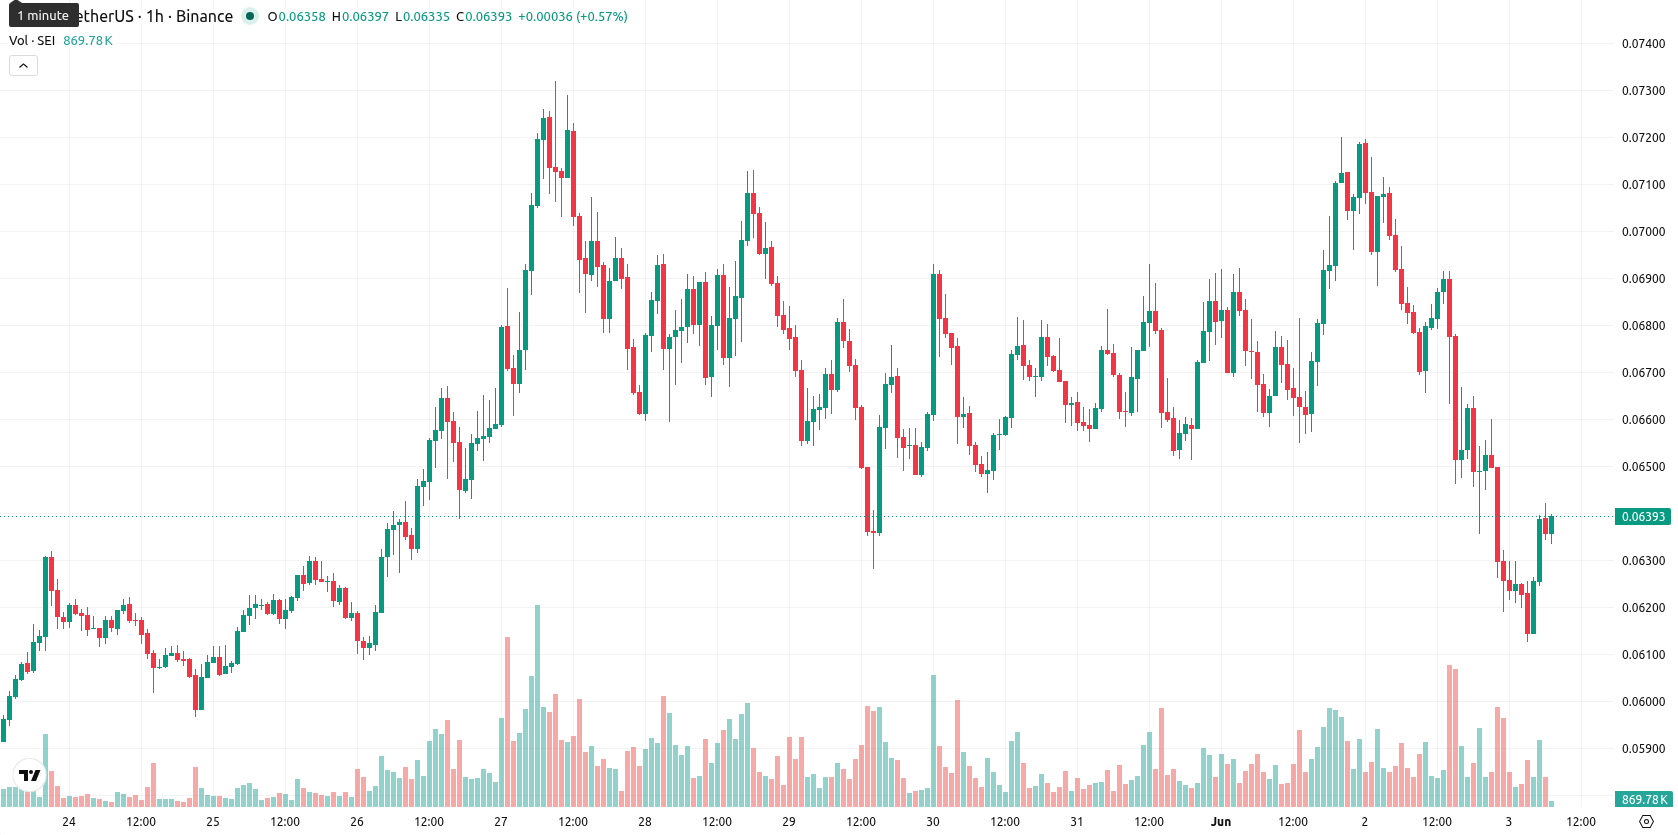
Sei (SEI) is trading at $0.0636, marking a daily decline of 7.18%. The asset currently sits just below its key short-term moving average, while maintaining levels above the medium-term average and remaining well beneath its long-term average.
Highlights
- SEI faces persistent long-term bearish pressure as it trades below major moving averages amid recent volatility.
- Technical indicators are mixed, with short-term signals showing oversold conditions but suggesting weak momentum for any near-term rebound.
- The expected trading range for SEI this week is $0.0600–$0.0680, with a breakdown below $0.0600 likely confirming further downside.
Mixed momentum emerges amid intraday volatility and resistance tests
On the technical front, SEI opened with a gap down from $0.0685 to $0.0626 and has traded within a wide intraday band of $0.0613–$0.064. The current price sits just below the SMA-20 ($0.0640), above the SMA-50 ($0.0623), and remains well beneath the SMA-200 ($0.0872); immediate resistance is at the Ichimoku Kijun level of $0.0692. Momentum signals are mixed: daily MACD and ADX show budding bullish momentum, while the RSI at 46 leans bearish and the Stochastic RSI marks oversold territory. CCI is neutral, and Bull/Bear Power (BBP) indicates intraday buyer dominance, though this contrasts with the overall negative daily performance and volatile selloff after the open.
Limited upside risk as bearish outlook dominates near term
Looking ahead, typical volatility over the next five days is forecast within the $0.0600–$0.0680 range. The probability of an upward move remains low (under 20%), implying that a further decline or ongoing consolidation is likely within the stated price corridor. Any bullish shift would require a sustained breakout above the $0.0692 resistance level, while a move below $0.0600 would confirm a bearish scenario.
Earlier, analysts noted that Sei was caught between conflicting momentum signals and heightened volatility, reinforcing an uncertain near-term outlook. With the latest data highlighting persistent volatility, a key risk for traders is that any attempt at recovery could be abruptly reversed unless Sei decisively clears resistance at the $0.0692 level.


-
 Afghanistan
-
 Albania
-
 Algeria
-
 Angola
-
 Argentina
-
 Armenia
-
 Australia
-
 Austria
-
 Azerbaijan
-
 Bahamas
-
 Bahrain
-
 Bangladesh
-
 Belarus
-
 Belgium
-
 Bolivia
-
 Botswana
-
 Brazil
-
 Brunei
-
 Bulgaria
-
 Cambodia
-
 Cameroon
-
 Canada
-
 Chile
Chile
-
 China
China
-
 Colombia
-
 Congo
Congo
-
 Costa Rica
-
 Cote d'Ivoire
-
 Croatia
-
 Cuba
Cuba
-
 Cyprus
-
 Czechia
-
 DR Congo
-
 Denmark
-
 Dominican Republic
-
 Ecuador
-
 Egypt
Egypt
-
 El Salvador
-
 Estonia
-
 Eswatini
-
 Ethiopia
-
 Finland
-
 France
-
 Georgia
-
 Germany
-
 Ghana
Ghana
-
 Greece
-
 Haiti
Haiti
-
 Hong Kong
-
 Hungary
-
 India
India
-
 Indonesia
-
 Iran, Islamic republic
-
 Iraq
Iraq
-
 Ireland
-
 Israel
-
 Italy
Italy
-
 Jamaica
-
 Japan
Japan
-
 Jordan
-
 Kazakhstan
-
 Kenya
Kenya
-
 Korea
Korea
-
 Kuwait
-
 Kyrgyzstan
-
 Laos
Laos
-
 Latvia
-
 Lebanon
-
 Lesotho
-
 Libya
Libya
-
 Lithuania
-
 Luxembourg
-
 Madagascar
-
 Malaysia
-
 Malta
Malta
-
 Mauritius
-
 Mexico
-
 Moldova
-
 Mongolia
-
 Montenegro
-
 Morocco
-
 Mozambique
-
 Myanmar
-
 Namibia
-
 Nepal
Nepal
-
 Netherlands
-
 New Zealand
-
 Nigeria
-
 North Macedonia
-
 Norway
-
 Oman
Oman
-
 Pakistan
-
 Palestine
-
 Panama
-
 Papua New Guinea
-
 Paraguay
-
 Peru
Peru
-
 Philippines
-
 Poland
-
 Portugal
-
 Puerto Rico
-
 Qatar
Qatar
-
 Reunion
-
 Romania
-
 Rwanda
-
 Saudi Arabia
-
 Serbia
-
 Singapore
-
 Slovakia
-
 Slovenia
-
 Somalia
-
 South Africa
-
 Spain
Spain
-
 Sri Lanka
-
 Sweden
-
 Switzerland
-
 Syria
Syria
-
 Taiwan
-
 Tajikistan
-
 Tanzania
-
 Thailand
-
 Trinidad and Tobago
-
 Tunisia
-
 Turkey
-
 UAE
UAE
-
 Uganda
-
 Ukraine
-
 United Kingdom
-
United States
-
 Uruguay
-
 Uzbekistan
-
 Venezuela
-
 Vietnam
-
 Yemen
Yemen
-
 Zambia
-
 Zimbabwe
- Forex
- Crypto
