
Dominant selling pressure sends NEAR lower into oversold area

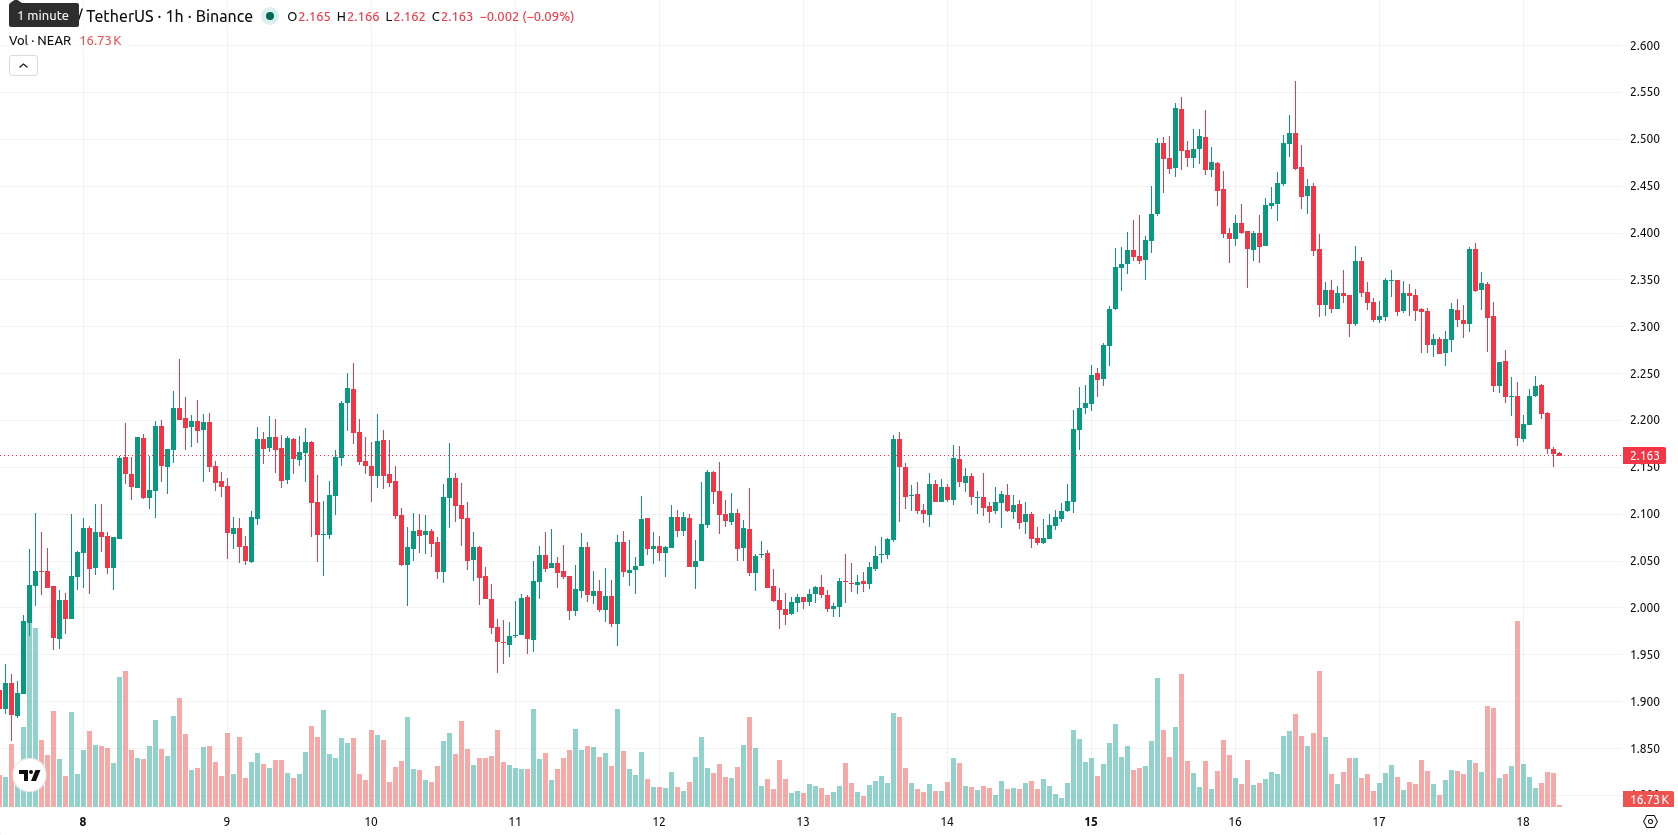
NEAR (NEAR) is trading at $2.165, down 7.20% on the day. The asset is positioned below its key moving averages on short and medium timeframes, indicating prevailing downward momentum.
Highlights
- NEAR/USD is under sustained short- and medium-term selling pressure, trading below key moving averages on the H1 chart.
- Momentum and oscillator indicators signal an ongoing selloff with oversold conditions, while volatility remains elevated and sellers dominate intraday.
- Expected trading range for the next 2–3 days is $2.0342 to $2.2958, with a high probability of further downside unless resistance breaks.
Oversold signals deepen as price holds above long-term support
On the technical front, NEAR/USD is trading below both the MA-20 ($2.2596) and MA-50 ($2.3224) on the H1 timeframe, while remaining above the long-term MA-200 ($1.5251). Nearby resistance levels are marked by the Ichimoku Kijun at $2.2695. Momentum indicators show the MACD on Sell, ADX in a neutral trend, and RSI at 34.429 indicating oversold conditions. Both Stoch RSI and CCI also signal oversold, with BBP on Sell, confirming sustained intraday selling pressure. The Awesome Oscillator remains neutral in the current setup.
Further downside risk grows as upside breakout probability wanes
Over the next 2–3 trading days, NEAR/USD is likely to fluctuate within a typical volatility band between $2.0342 and $2.2958. The probability of an upward move remains very low, while there is a much higher likelihood of a continued decline. Baseline expectations are for the price to remain within this range; a break above Kijun resistance at $2.2695 could trigger short-term upward momentum, while a drop below $2.0342 may signal further downside and renewed selling activity.
Earlier, analysts noted that NEAR maintained a generally bullish technical structure despite facing periods of heightened volatility and downside pressure. The current breakdown below key moving averages marks a clear shift toward sustained bearish momentum, making the $2.0342 support level critical to watch for potential further declines in the near term.


-
 Afghanistan
-
 Albania
-
 Algeria
-
 Angola
-
 Argentina
-
 Armenia
-
 Australia
-
 Austria
-
 Azerbaijan
-
 Bahamas
-
 Bahrain
-
 Bangladesh
-
 Belarus
-
 Belgium
-
 Bolivia
-
 Botswana
-
 Brazil
-
 Brunei
-
 Bulgaria
-
 Cambodia
-
 Cameroon
-
 Canada
-
 Chile
Chile
-
 China
China
-
 Colombia
-
 Congo
Congo
-
 Costa Rica
-
 Cote d'Ivoire
-
 Croatia
-
 Cuba
Cuba
-
 Cyprus
-
 Czechia
-
 DR Congo
-
 Denmark
-
 Dominican Republic
-
 Ecuador
-
 Egypt
Egypt
-
 El Salvador
-
 Estonia
-
 Eswatini
-
 Ethiopia
-
 Finland
-
 France
-
 Georgia
-
 Germany
-
 Ghana
Ghana
-
 Greece
-
 Haiti
Haiti
-
 Hong Kong
-
 Hungary
-
 India
India
-
 Indonesia
-
 Iran, Islamic republic
-
 Iraq
Iraq
-
 Ireland
-
 Israel
-
 Italy
Italy
-
 Jamaica
-
 Japan
Japan
-
 Jordan
-
 Kazakhstan
-
 Kenya
Kenya
-
 Korea
Korea
-
 Kuwait
-
 Kyrgyzstan
-
 Laos
Laos
-
 Latvia
-
 Lebanon
-
 Lesotho
-
 Libya
Libya
-
 Lithuania
-
 Luxembourg
-
 Madagascar
-
 Malaysia
-
 Malta
Malta
-
 Mauritius
-
 Mexico
-
 Moldova
-
 Mongolia
-
 Montenegro
-
 Morocco
-
 Mozambique
-
 Myanmar
-
 Namibia
-
 Nepal
Nepal
-
 Netherlands
-
 New Zealand
-
 Nigeria
-
 North Macedonia
-
 Norway
-
 Oman
Oman
-
 Pakistan
-
 Palestine
-
 Panama
-
 Papua New Guinea
-
 Paraguay
-
 Peru
Peru
-
 Philippines
-
 Poland
-
 Portugal
-
 Puerto Rico
-
 Qatar
Qatar
-
 Reunion
-
 Romania
-
 Rwanda
-
 Saudi Arabia
-
 Serbia
-
 Singapore
-
 Slovakia
-
 Slovenia
-
 Somalia
-
 South Africa
-
 Spain
Spain
-
 Sri Lanka
-
 Sweden
-
 Switzerland
-
 Syria
Syria
-
 Taiwan
-
 Tajikistan
-
 Tanzania
-
 Thailand
-
 Trinidad and Tobago
-
 Tunisia
-
 Turkey
-
 UAE
UAE
-
 Uganda
-
 Ukraine
-
 United Kingdom
-
United States
-
 Uruguay
-
 Uzbekistan
-
 Venezuela
-
 Vietnam
-
 Yemen
Yemen
-
 Zambia
-
 Zimbabwe
- Forex
- Crypto
