
Pepe navigates selling pressure with oversold technical signals: weekly analysis

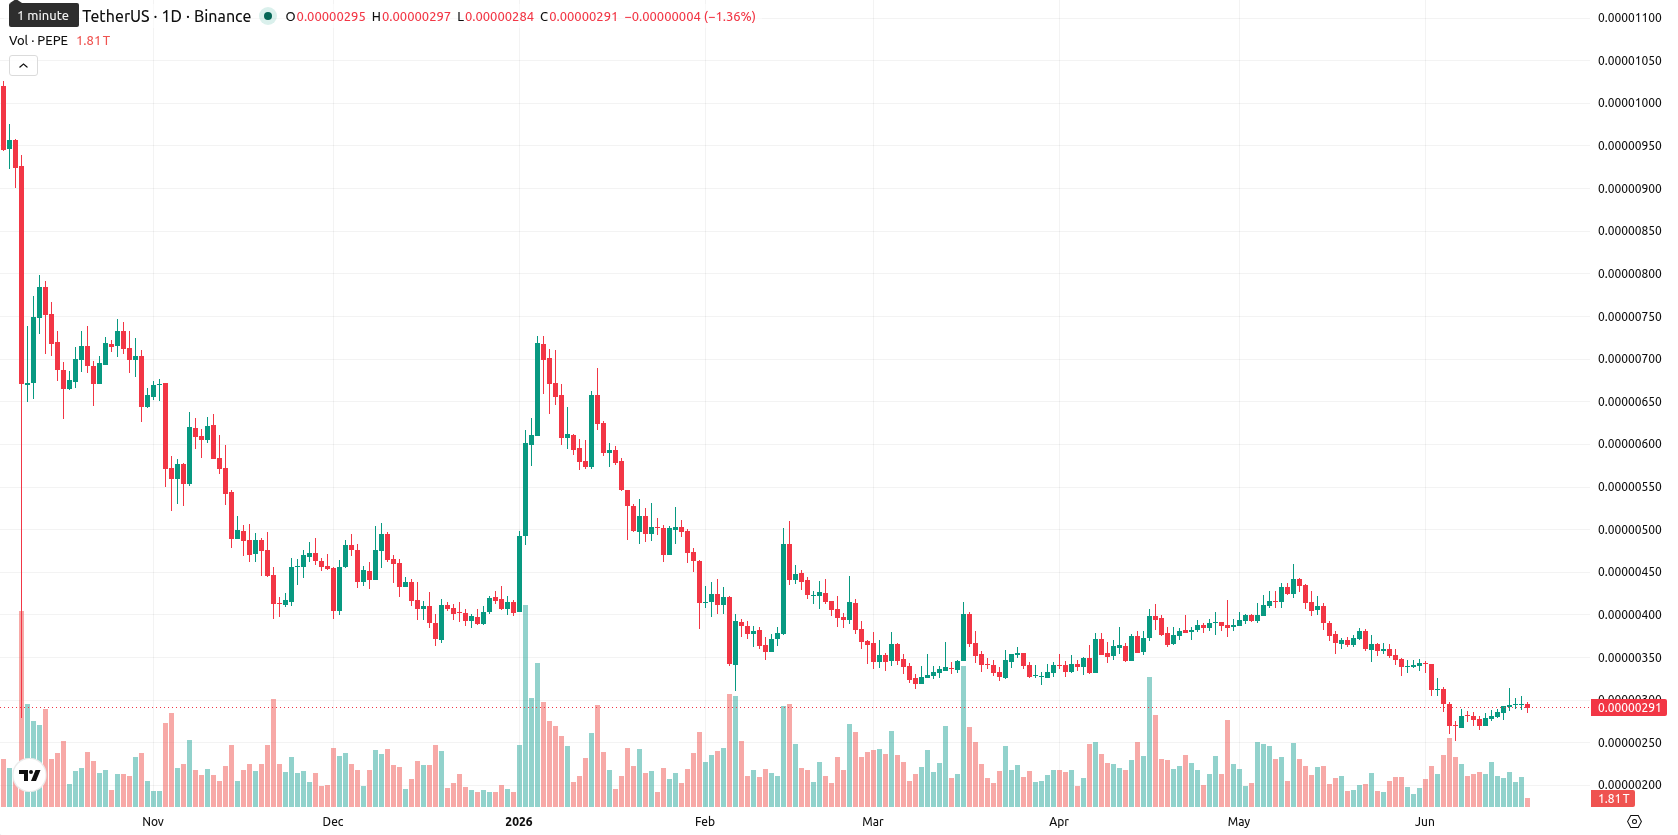
Pepe (PEPE) is currently trading at $0.0000029, marking a weekly increase of $0.00000013 or 5.05%. The asset remains positioned below both the weekly MA-20 of $0.000003557 and the MA-50 at $0.000006153, signaling sustained medium- and long-term selling pressure, with price lingering in the lower segment of its weekly range.
Highlights
- PEPE remains in a downtrend, trading below key moving averages and encountering ongoing medium- and long-term selling pressure.
- Multiple technical indicators signal a bearish outlook, with weak momentum and oversold oscillators confirming continued seller dominance.
- PEPE is likely to trade between $0.0000025 and $0.0000033 over the next week, with a higher probability of further declines.
ETF registration and whale accumulation drive optimism amid regulatory delays
Canary Capital submitted an S-1 registration to the SEC in April 2026 for a proposed spot PEPE ETF, representing a major regulatory milestone that could open access for institutional investors. During this period, whale wallets accumulated about 23 trillion PEPE tokens, highlighting active accumulation despite uncertain market conditions. The ETF review is expected to be protracted, with immediate approval unlikely.
Persisting downside momentum as technical indicators reinforce oversold signals
Technical analysis on the weekly timeframe shows PEPE trading below both the MA-20 ($0.000003557) and the MA-50 ($0.000006153), which confirms the persistence of downward momentum and positions the MA-20 as the closest dynamic resistance. Momentum remains weak overall — the MACD signals a strong sell, the ADX shows a low-trend neutral environment, and major oscillators including RSI (near 38), Stochastic RSI, and CCI all reflect oversold conditions. Weekly volatility stands at 14.18%, and both Bull/Bear Power and the Awesome Oscillator favor continued selling pressure. Key support for this week is at $0.0000025, while resistance stands at $0.0000033.
Sideways trading expected as technicals cap upside for next week
Over the next 7 days, PEPE is likely to trade within a range of $0.0000025 to $0.0000033, reflecting recent volatility and neutral-to-bearish technical signals on the W1 chart. The most probable scenario is further sideways movement inside this range, as none of the four main weekly indicators suggest a bullish reversal. A break above resistance at $0.0000033 would be required for sustained upside, but this remains unlikely given prevailing signals. The bearish scenario sees the price fall below $0.0000025 if selling pressure intensifies.
Previously it was reported that Pepe displayed short-term bullish momentum but remained under sustained selling pressure across medium- and long-term timeframes. With continued weakness in the main weekly indicators and a prolonged regulatory timeline for the proposed ETF, traders should monitor for any deviation from the prevailing sideways-to-bearish scenario, particularly in response to future shifts in institutional activity.


-
 Afghanistan
-
 Albania
-
 Algeria
-
 Angola
-
 Argentina
-
 Armenia
-
 Australia
-
 Austria
-
 Azerbaijan
-
 Bahamas
-
 Bahrain
-
 Bangladesh
-
 Belarus
-
 Belgium
-
 Bolivia
-
 Botswana
-
 Brazil
-
 Brunei
-
 Bulgaria
-
 Cambodia
-
 Cameroon
-
 Canada
-
 Chile
Chile
-
 China
China
-
 Colombia
-
 Congo
Congo
-
 Costa Rica
-
 Cote d'Ivoire
-
 Croatia
-
 Cuba
Cuba
-
 Cyprus
-
 Czechia
-
 DR Congo
-
 Denmark
-
 Dominican Republic
-
 Ecuador
-
 Egypt
Egypt
-
 El Salvador
-
 Estonia
-
 Eswatini
-
 Ethiopia
-
 Finland
-
 France
-
 Georgia
-
 Germany
-
 Ghana
Ghana
-
 Greece
-
 Haiti
Haiti
-
 Hong Kong
-
 Hungary
-
 India
India
-
 Indonesia
-
 Iran, Islamic republic
-
 Iraq
Iraq
-
 Ireland
-
 Israel
-
 Italy
Italy
-
 Jamaica
-
 Japan
Japan
-
 Jordan
-
 Kazakhstan
-
 Kenya
Kenya
-
 Korea
Korea
-
 Kuwait
-
 Kyrgyzstan
-
 Laos
Laos
-
 Latvia
-
 Lebanon
-
 Lesotho
-
 Libya
Libya
-
 Lithuania
-
 Luxembourg
-
 Madagascar
-
 Malaysia
-
 Malta
Malta
-
 Mauritius
-
 Mexico
-
 Moldova
-
 Mongolia
-
 Montenegro
-
 Morocco
-
 Mozambique
-
 Myanmar
-
 Namibia
-
 Nepal
Nepal
-
 Netherlands
-
 New Zealand
-
 Nigeria
-
 North Macedonia
-
 Norway
-
 Oman
Oman
-
 Pakistan
-
 Palestine
-
 Panama
-
 Papua New Guinea
-
 Paraguay
-
 Peru
Peru
-
 Philippines
-
 Poland
-
 Portugal
-
 Puerto Rico
-
 Qatar
Qatar
-
 Reunion
-
 Romania
-
 Rwanda
-
 Saudi Arabia
-
 Serbia
-
 Singapore
-
 Slovakia
-
 Slovenia
-
 Somalia
-
 South Africa
-
 Spain
Spain
-
 Sri Lanka
-
 Sweden
-
 Switzerland
-
 Syria
Syria
-
 Taiwan
-
 Tajikistan
-
 Tanzania
-
 Thailand
-
 Trinidad and Tobago
-
 Tunisia
-
 Turkey
-
 UAE
UAE
-
 Uganda
-
 Ukraine
-
 United Kingdom
-
United States
-
 Uruguay
-
 Uzbekistan
-
 Venezuela
-
 Vietnam
-
 Yemen
Yemen
-
 Zambia
-
 Zimbabwe
- Forex
- Crypto
