
Jupiter price prediction: $0.2091 breakout resistance in focus? JUP rises 7.21%

Jupiter (JUP) is trading at $0.2007, up 7.21% on the day. The asset sits above its key moving averages, reflecting notable upward momentum and positioning.
Highlights
- JUP/USD sustains a bullish price structure across multiple timeframes with strong upward momentum confirmed by several technical indicators.
- Short-term oscillator signals indicate overbought conditions, raising the risk of a pullback despite dominant buyer interest.
- Expected range for the next 2–3 days is $0.1923 to $0.2091, with a breakout above $0.2091 suggesting further upside.
Bullish signals confront overbought warnings on H1 technicals
On the H1 chart, JUP/USD trades above the MA-20, MA-50, and MA-200, showing clear alignment across short and long-term periods. The Ichimoku Kijun at $0.1927 provides immediate support. Momentum indicators reveal a bullish MACD while ADX is neutral. The RSI remains in the Buy zone, but both Stoch RSI and CCI register overbought conditions, suggesting the current upside may be overstretched. Bull/Bear Power (BBP) continues to indicate strong buying activity and the Awesome Oscillator supports the ongoing bullish trend.
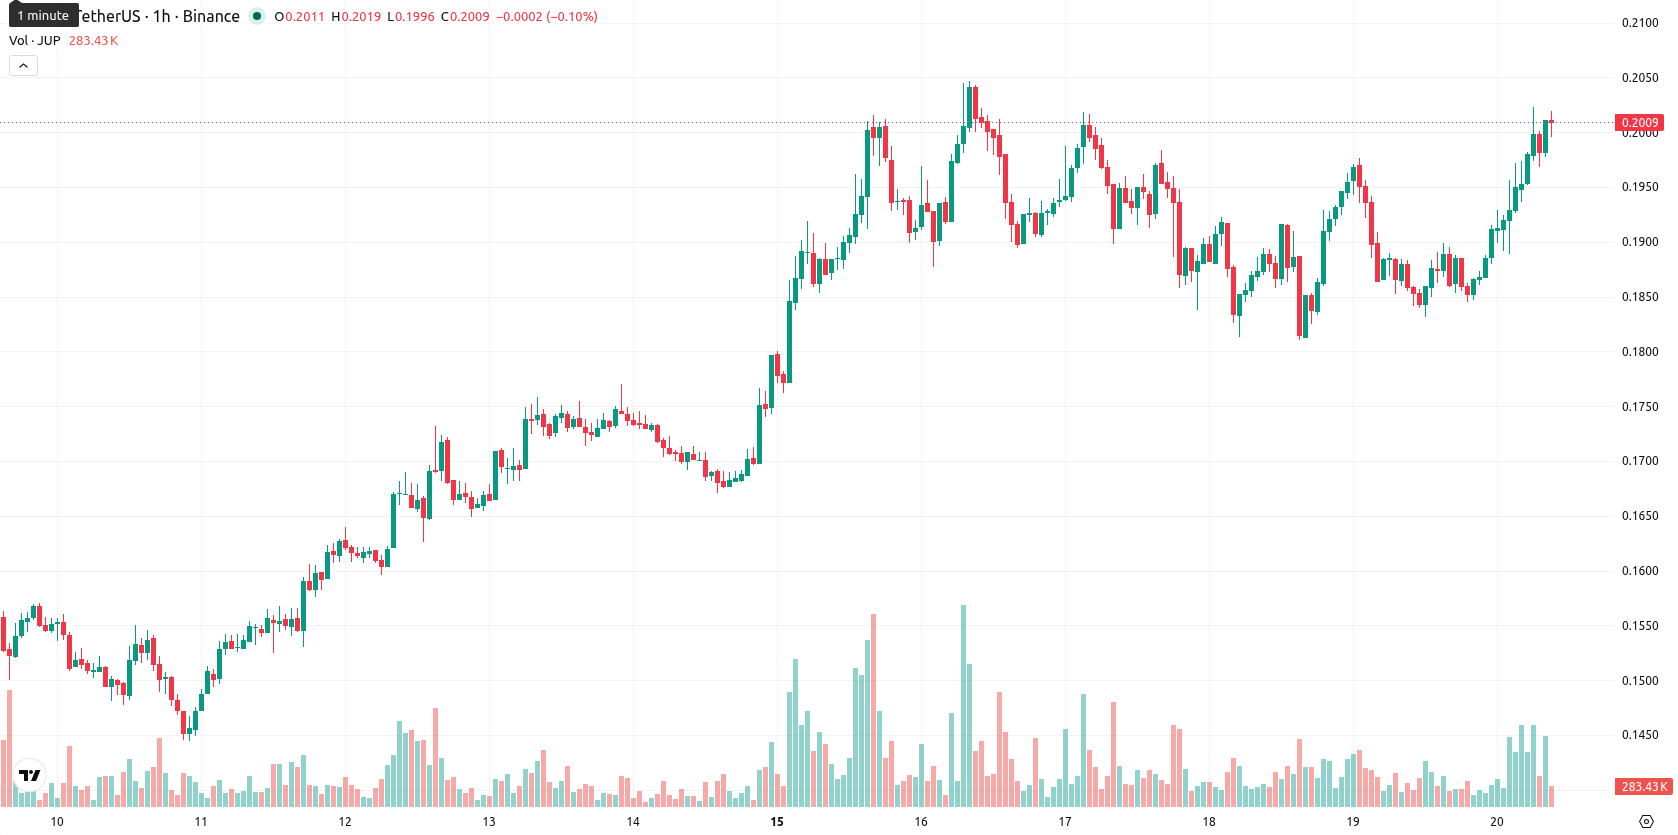
Consolidation likely with upside breakout risk prevailing
Over the next two to three trading days, JUP/USD is likely to consolidate within the $0.1923 to $0.2091 range, in line with typical volatility for the asset. There is a very high probability of further upward movement, while a downside move below $0.1923 is considered unlikely. A push above $0.2091 would indicate breakout momentum, but a decline under $0.1923 may trigger a deeper pullback scenario.
Earlier, analysts noted that Jupiter was exhibiting continued bullish momentum, underpinned by structural supply constraints and growing market interest. This outlook is reinforced by the latest price action and indicator alignment, making a sustained move above $0.2091 the key signal to watch for confirming further upside potential.


-
 Afghanistan
-
 Albania
-
 Algeria
-
 Angola
-
 Argentina
-
 Armenia
-
 Australia
-
 Austria
-
 Azerbaijan
-
 Bahamas
-
 Bahrain
-
 Bangladesh
-
 Belarus
-
 Belgium
-
 Bolivia
-
 Botswana
-
 Brazil
-
 Brunei
-
 Bulgaria
-
 Cambodia
-
 Cameroon
-
 Canada
-
 Chile
Chile
-
 China
China
-
 Colombia
-
 Congo
Congo
-
 Costa Rica
-
 Cote d'Ivoire
-
 Croatia
-
 Cuba
Cuba
-
 Cyprus
-
 Czechia
-
 DR Congo
-
 Denmark
-
 Dominican Republic
-
 Ecuador
-
 Egypt
Egypt
-
 El Salvador
-
 Estonia
-
 Eswatini
-
 Ethiopia
-
 Finland
-
 France
-
 Georgia
-
 Germany
-
 Ghana
Ghana
-
 Greece
-
 Haiti
Haiti
-
 Hong Kong
-
 Hungary
-
 India
India
-
 Indonesia
-
 Iran, Islamic republic
-
 Iraq
Iraq
-
 Ireland
-
 Israel
-
 Italy
Italy
-
 Jamaica
-
 Japan
Japan
-
 Jordan
-
 Kazakhstan
-
 Kenya
Kenya
-
 Korea
Korea
-
 Kuwait
-
 Kyrgyzstan
-
 Laos
Laos
-
 Latvia
-
 Lebanon
-
 Lesotho
-
 Libya
Libya
-
 Lithuania
-
 Luxembourg
-
 Madagascar
-
 Malaysia
-
 Malta
Malta
-
 Mauritius
-
 Mexico
-
 Moldova
-
 Mongolia
-
 Montenegro
-
 Morocco
-
 Mozambique
-
 Myanmar
-
 Namibia
-
 Nepal
Nepal
-
 Netherlands
-
 New Zealand
-
 Nigeria
-
 North Macedonia
-
 Norway
-
 Oman
Oman
-
 Pakistan
-
 Palestine
-
 Panama
-
 Papua New Guinea
-
 Paraguay
-
 Peru
Peru
-
 Philippines
-
 Poland
-
 Portugal
-
 Puerto Rico
-
 Qatar
Qatar
-
 Reunion
-
 Romania
-
 Rwanda
-
 Saudi Arabia
-
 Serbia
-
 Singapore
-
 Slovakia
-
 Slovenia
-
 Somalia
-
 South Africa
-
 Spain
Spain
-
 Sri Lanka
-
 Sweden
-
 Switzerland
-
 Syria
Syria
-
 Taiwan
-
 Tajikistan
-
 Tanzania
-
 Thailand
-
 Trinidad and Tobago
-
 Tunisia
-
 Turkey
-
 UAE
UAE
-
 Uganda
-
 Ukraine
-
 United Kingdom
-
United States
-
 Uruguay
-
 Uzbekistan
-
 Venezuela
-
 Vietnam
-
 Yemen
Yemen
-
 Zambia
-
 Zimbabwe
- Forex
- Crypto
