
-7.23% for Jupiter as trading stays within a sideways range

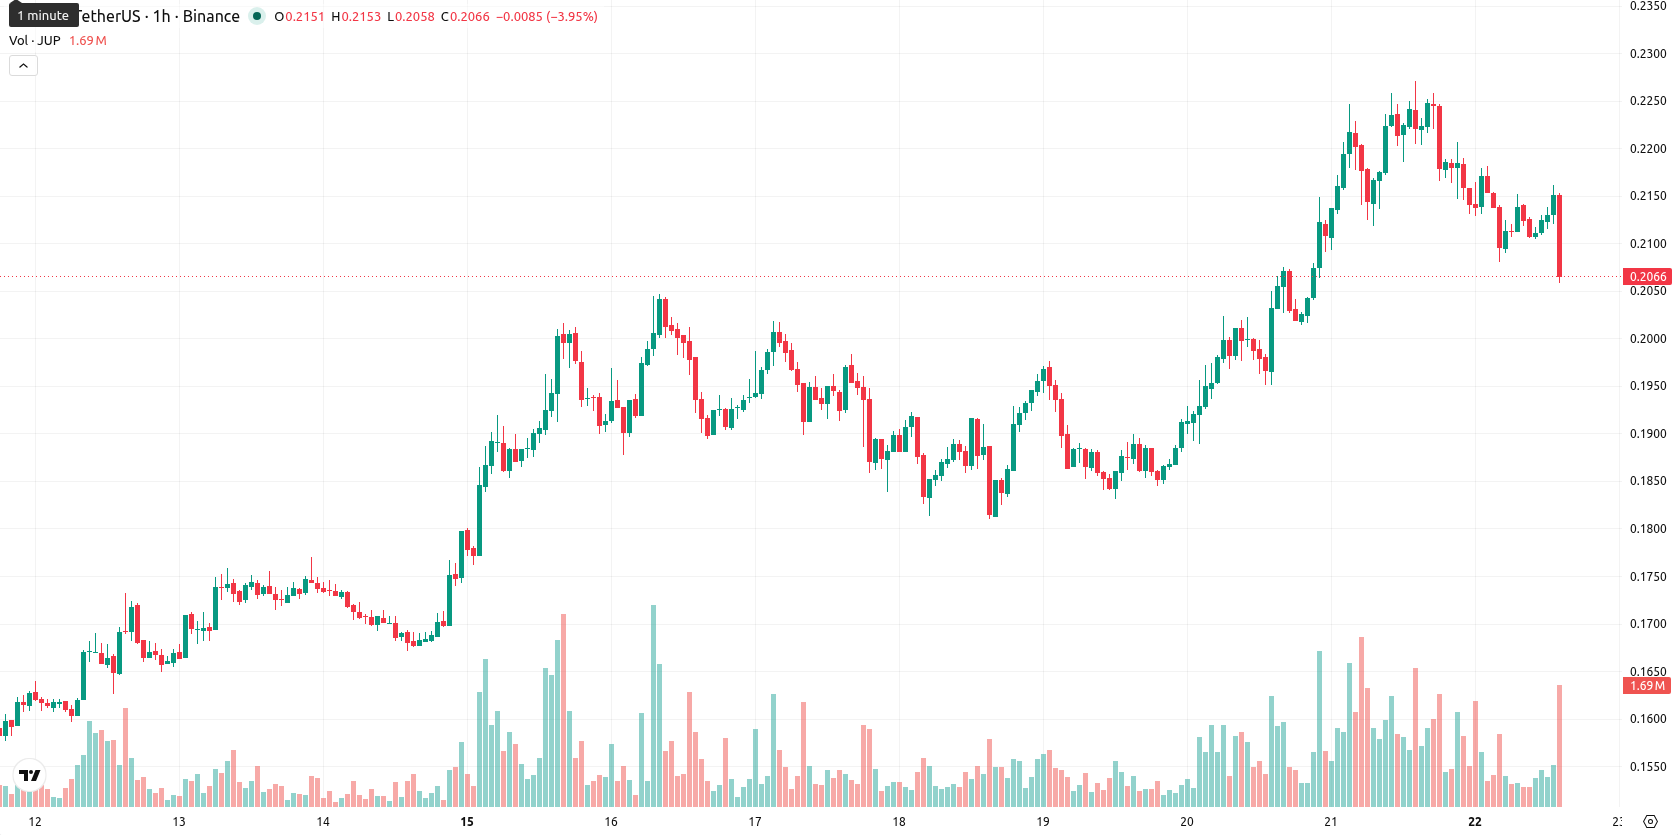
Jupiter (JUP) is trading at $0.2066 after a daily decline of 7.23%. The asset is positioned below its key short- and medium-term moving averages, reflecting pressure from sellers.
Highlights
- Jupiter (JUP) trading volume surged 113.83% to nearly $496 million, reflecting heightened market engagement and liquidity.
- Despite elevated volumes, JUP's price declined 7.23% intraday as increased flows failed to counter persistent selling pressure.
- Technical signals are mixed amid high volatility, with price expected to oscillate within the $0.1963 to $0.2263 range in coming sessions.
Volume spike intensifies price swings as seller pressure persists
Jupiter (JUP) experienced a pronounced increase in trading volume, with activity jumping 113.83% to nearly $496 million, according to AMBCrypto. This surge in volume indicates notable market participation and liquidity, which often amplifies price fluctuations in the short term. The influx of trading activity occurred against a backdrop of downward price action, suggesting that intensified flows alone have not offset seller pressure today.
Resistance holds as technical signals diverge on momentum outlook
JUP/USD is trading below the MA-20 and MA-50 but holds above the MA-200, suggesting long-term support at lower levels. The Ichimoku Kijun line is set at $0.2176, serving as immediate resistance. Momentum indicators display mixed signals: MACD suggests sellers are in control, ADX signals a latent bullish trend, RSI flashes a buy, Stoch RSI is overbought, and CCI remains neutral. Bull/Bear Power indicates strong intraday demand from buyers, while the Awesome Oscillator maintains a neutral stance.
Range-bound scenario favored amid volatility and breakout risks
In the near term, JUP/USD is expected to oscillate within the $0.1963 to $0.2263 range, reflecting typical volatility for the asset. The most probable scenario is continued sideways movement within this band. A break above immediate resistance at $0.2176 could trigger renewed upside momentum, while a move below $0.1963 may prompt further selling into the lower end of the projected range.
Earlier, analysts noted that Jupiter was exhibiting strong bullish momentum driven by sustained technical strength and elevated volatility. The recent surge in trading volume amid downward price action signals increased market uncertainty and may lead to heightened volatility, making the $0.2176 resistance level a crucial threshold for potential trend reversal.


-
 Afghanistan
-
 Albania
-
 Algeria
-
 Angola
-
 Argentina
-
 Armenia
-
 Australia
-
 Austria
-
 Azerbaijan
-
 Bahamas
-
 Bahrain
-
 Bangladesh
-
 Belarus
-
 Belgium
-
 Bolivia
-
 Botswana
-
 Brazil
-
 Brunei
-
 Bulgaria
-
 Cambodia
-
 Cameroon
-
 Canada
-
 Chile
Chile
-
 China
China
-
 Colombia
-
 Congo
Congo
-
 Costa Rica
-
 Cote d'Ivoire
-
 Croatia
-
 Cuba
Cuba
-
 Cyprus
-
 Czechia
-
 DR Congo
-
 Denmark
-
 Dominican Republic
-
 Ecuador
-
 Egypt
Egypt
-
 El Salvador
-
 Estonia
-
 Eswatini
-
 Ethiopia
-
 Finland
-
 France
-
 Georgia
-
 Germany
-
 Ghana
Ghana
-
 Greece
-
 Haiti
Haiti
-
 Hong Kong
-
 Hungary
-
 India
India
-
 Indonesia
-
 Iran, Islamic republic
-
 Iraq
Iraq
-
 Ireland
-
 Israel
-
 Italy
Italy
-
 Jamaica
-
 Japan
Japan
-
 Jordan
-
 Kazakhstan
-
 Kenya
Kenya
-
 Korea
Korea
-
 Kuwait
-
 Kyrgyzstan
-
 Laos
Laos
-
 Latvia
-
 Lebanon
-
 Lesotho
-
 Libya
Libya
-
 Lithuania
-
 Luxembourg
-
 Madagascar
-
 Malaysia
-
 Malta
Malta
-
 Mauritius
-
 Mexico
-
 Moldova
-
 Mongolia
-
 Montenegro
-
 Morocco
-
 Mozambique
-
 Myanmar
-
 Namibia
-
 Nepal
Nepal
-
 Netherlands
-
 New Zealand
-
 Nigeria
-
 North Macedonia
-
 Norway
-
 Oman
Oman
-
 Pakistan
-
 Palestine
-
 Panama
-
 Papua New Guinea
-
 Paraguay
-
 Peru
Peru
-
 Philippines
-
 Poland
-
 Portugal
-
 Puerto Rico
-
 Qatar
Qatar
-
 Reunion
-
 Romania
-
 Rwanda
-
 Saudi Arabia
-
 Serbia
-
 Singapore
-
 Slovakia
-
 Slovenia
-
 Somalia
-
 South Africa
-
 Spain
Spain
-
 Sri Lanka
-
 Sweden
-
 Switzerland
-
 Syria
Syria
-
 Taiwan
-
 Tajikistan
-
 Tanzania
-
 Thailand
-
 Trinidad and Tobago
-
 Tunisia
-
 Turkey
-
 UAE
UAE
-
 Uganda
-
 Ukraine
-
 United Kingdom
-
United States
-
 Uruguay
-
 Uzbekistan
-
 Venezuela
-
 Vietnam
-
 Yemen
Yemen
-
 Zambia
-
 Zimbabwe
- Forex
- Crypto
