
Tezos falls nearly 7% as sellers maintain control in the short term

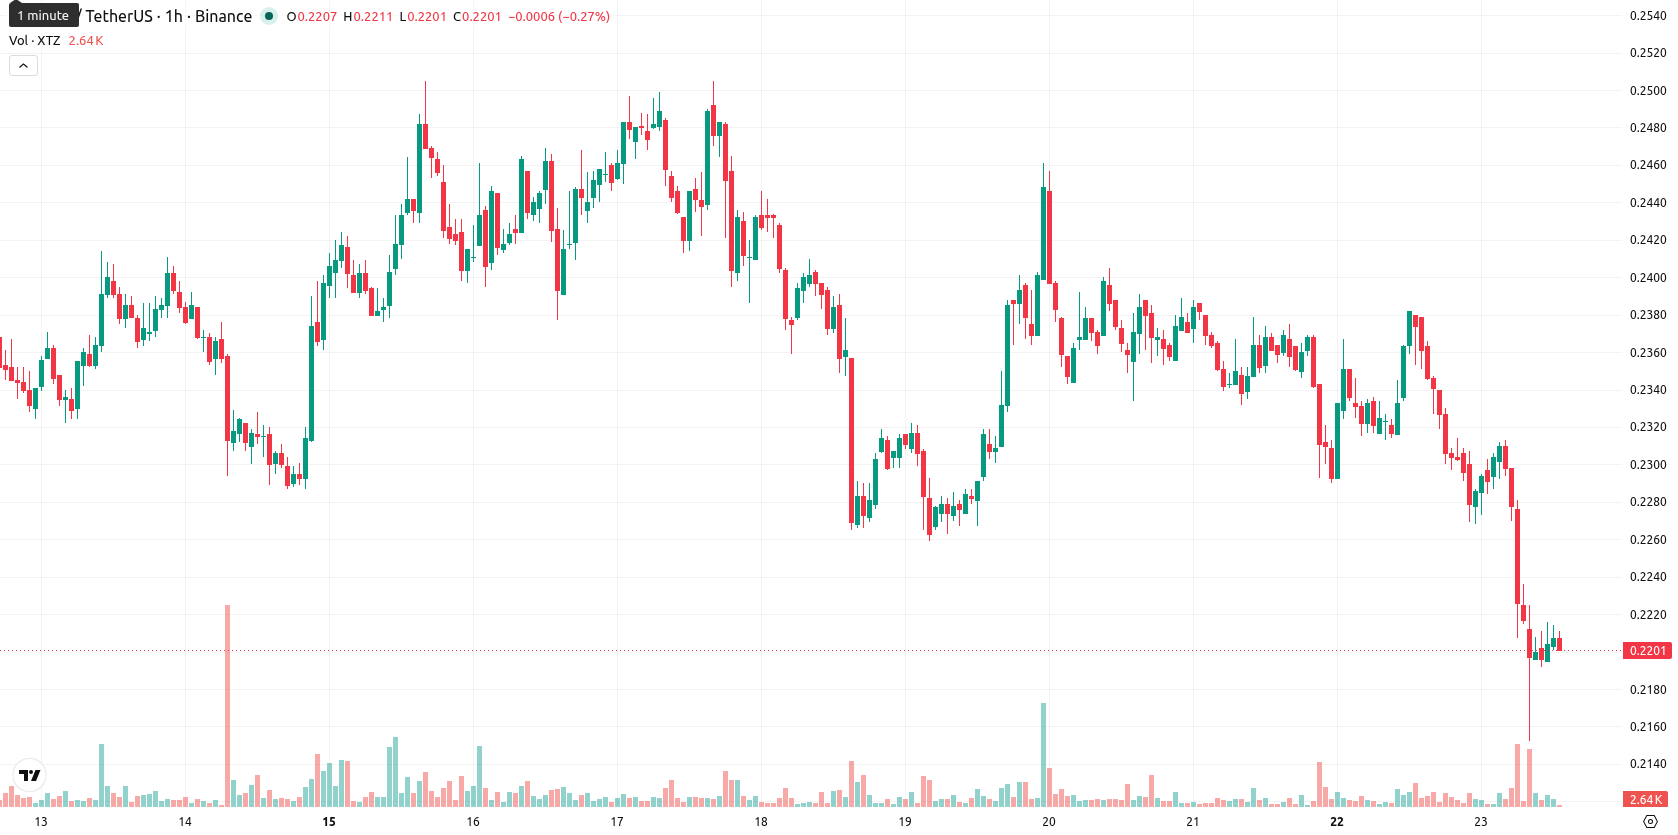
Tezos (XTZ) is trading at $0.2205, down 6.88% on the day. The price remains below its key moving averages.
 0.227
0.23420000
0.227
0.23420000
Highlights
- XTZ/USD remains under strong bearish pressure, trading below key short-, medium-, and long-term moving averages.
- Momentum and trend indicators confirm a prevailing sell bias, with near-oversold conditions but no clear reversal signal.
- Expected price range is $0.21499927 to $0.22600073 over the next 2–3 days, with high probability of further downside.
Sell bias deepens as volatility rises and oversold readings emerge
XTZ/USD has moved below the MA-20 at $0.226635 and MA-50 at $0.231242 on the hourly chart, and is also trading well under the long-term MA-200 at $0.4031015. The Ichimoku Kijun level at $0.2268 marks immediate resistance. Momentum indicators show continued negative pressure, with both MACD and ADX reflecting a prevailing sell bias. The RSI is at 30.66, approaching oversold territory, while the CCI is in sell territory. Stoch RSI is neutral, indicating near-oversold conditions but without a clear reversal signal. BBP signals sellers remain dominant intraday, and the Awesome Oscillator is neutral. XTZ/USD is near the session's low, and volatility has spiked significantly.
Downside risk increases as breakout and breakdown levels approach
In the short term, the price is expected to fluctuate between $0.21499927 and $0.22600073, forming a typical volatility band relative to current levels for the next 2–3 trading days. The likelihood of an upward move is very low, whereas continued declines have a higher probability. If XTZ breaks above $0.2268, this would create a short-term bullish scenario. Conversely, a drop below the lower end of the projected range would indicate a risk of deeper losses.
Earlier, analysts noted that Tezos had shifted to a bearish tone, with technical indicators and price action highlighting persistent downward pressure. The ongoing confirmation of bearish momentum, coupled with spiking volatility and the absence of a clear reversal signal, suggests traders should closely monitor the $0.2268 resistance as a potential inflection point for a near-term trend change.









-
 Afghanistan
-
 Albania
-
 Algeria
-
 Angola
-
 Argentina
-
 Armenia
-
 Australia
-
 Austria
-
 Azerbaijan
-
 Bahamas
-
 Bahrain
-
 Bangladesh
-
 Belarus
-
 Belgium
-
 Bolivia
-
 Botswana
-
 Brazil
-
 Brunei
-
 Bulgaria
-
 Cambodia
-
 Cameroon
-
 Canada
-
 Chile
Chile
-
 China
China
-
 Colombia
-
 Congo
Congo
-
 Costa Rica
-
 Cote d'Ivoire
-
 Croatia
-
 Cuba
Cuba
-
 Cyprus
-
 Czechia
-
 DR Congo
-
 Denmark
-
 Dominican Republic
-
 Ecuador
-
 Egypt
Egypt
-
 El Salvador
-
 Estonia
-
 Eswatini
-
 Ethiopia
-
 Finland
-
 France
-
 Georgia
-
 Germany
-
 Ghana
Ghana
-
 Greece
-
 Haiti
Haiti
-
 Hong Kong
-
 Hungary
-
 India
India
-
 Indonesia
-
 Iran, Islamic republic
-
 Iraq
Iraq
-
 Ireland
-
 Israel
-
 Italy
Italy
-
 Jamaica
-
 Japan
Japan
-
 Jordan
-
 Kazakhstan
-
 Kenya
Kenya
-
 Korea
Korea
-
 Kuwait
-
 Kyrgyzstan
-
 Laos
Laos
-
 Latvia
-
 Lebanon
-
 Lesotho
-
 Libya
Libya
-
 Lithuania
-
 Luxembourg
-
 Madagascar
-
 Malaysia
-
 Malta
Malta
-
 Mauritius
-
 Mexico
-
 Moldova
-
 Mongolia
-
 Montenegro
-
 Morocco
-
 Mozambique
-
 Myanmar
-
 Namibia
-
 Nepal
Nepal
-
 Netherlands
-
 New Zealand
-
 Nigeria
-
 North Macedonia
-
 Norway
-
 Oman
Oman
-
 Pakistan
-
 Palestine
-
 Panama
-
 Papua New Guinea
-
 Paraguay
-
 Peru
Peru
-
 Philippines
-
 Poland
-
 Portugal
-
 Puerto Rico
-
 Qatar
Qatar
-
 Reunion
-
 Romania
-
 Rwanda
-
 Saudi Arabia
-
 Serbia
-
 Singapore
-
 Slovakia
-
 Slovenia
-
 Somalia
-
 South Africa
-
 Spain
Spain
-
 Sri Lanka
-
 Sweden
-
 Switzerland
-
 Syria
Syria
-
 Taiwan
-
 Tajikistan
-
 Tanzania
-
 Thailand
-
 Trinidad and Tobago
-
 Tunisia
-
 Turkey
-
 UAE
UAE
-
 Uganda
-
 Ukraine
-
 United Kingdom
-
United States
-
 Uruguay
-
 Uzbekistan
-
 Venezuela
-
 Vietnam
-
 Yemen
Yemen
-
 Zambia
-
 Zimbabwe
- Forex
- Crypto











