
Sonic drops 8.51% as sellers control the near-term trend

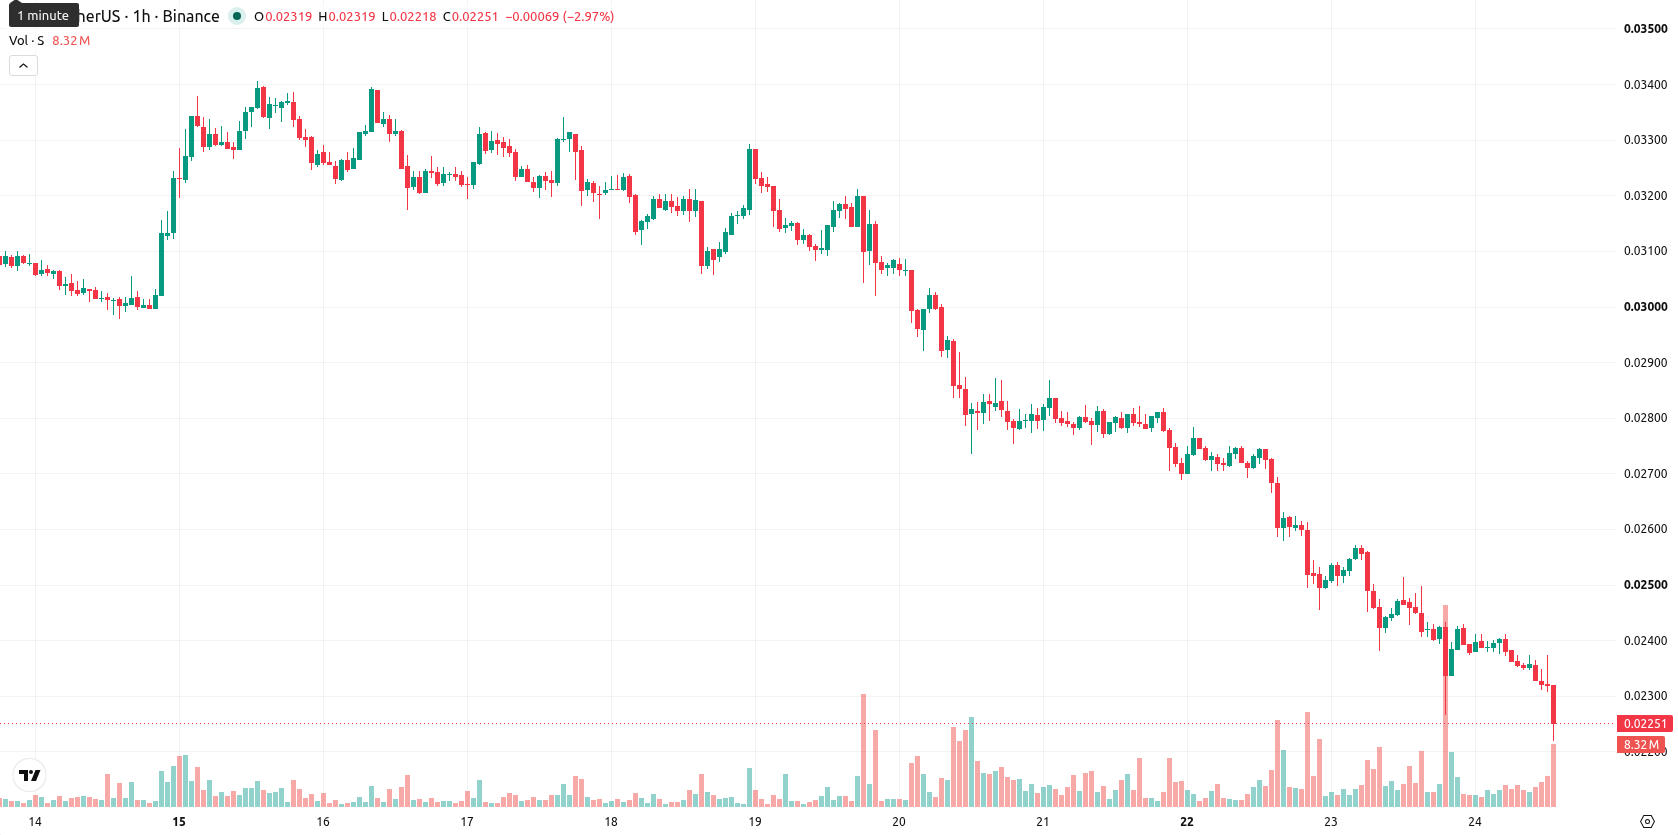
Sonic (S) is trading at $0.0225, down 8.51% on the day. The asset sits below its key moving averages, reflecting continued negative momentum.
Highlights
- S/USD shows persistent bearish momentum, trading below key moving averages across all timeframes and reinforcing a negative trend.
- Technical indicators signal strong selling pressure and oversold conditions, though some counteraction by buyers is emerging.
- Expect price consolidation between $0.0202 and $0.0248 over the next few days, with a 74% probability of further downside.
Momentum weakened as support nears and sell signals prevail
On the hourly chart, S is trading below the MA-20 at $0.0237 and MA-50 at $0.0247, while the daily chart shows the price well under the MA-200 at $0.0529. The Ichimoku Kijun sits at $0.0239 and now acts as immediate resistance. Momentum indicators remain weak: MACD signals a strong sell, ADX highlights selling pressure, and RSI is low at 33.48. Stoch RSI and CCI show oversold conditions, while BBP registers limited buyer activity. The Awesome Oscillator is neutral and does not confirm the overall trend.
Downside risks elevated as probability favors further declines
In the short term, S is expected to trade between $0.0202 and $0.0248 based on typical volatility. There is a 26% probability of an upward price move, compared to a higher likelihood of further downside at 74%. Base case: price consolidates within a narrow corridor. Bullish scenario: a move above $0.0239 could trigger a recovery. Bearish scenario: a drop below $0.0202 may lead to extended declines.
Earlier, analysts noted that Sonic faced persistent bearish momentum due to technical weakness and ongoing seller pressure. The current analysis strengthens this view, highlighting that until there is a sustained move above immediate resistance levels, further declines remain a significant risk for short-term traders.


-
 Afghanistan
-
 Albania
-
 Algeria
-
 Angola
-
 Argentina
-
 Armenia
-
 Australia
-
 Austria
-
 Azerbaijan
-
 Bahamas
-
 Bahrain
-
 Bangladesh
-
 Belarus
-
 Belgium
-
 Bolivia
-
 Botswana
-
 Brazil
-
 Brunei
-
 Bulgaria
-
 Cambodia
-
 Cameroon
-
 Canada
-
 Chile
Chile
-
 China
China
-
 Colombia
-
 Congo
Congo
-
 Costa Rica
-
 Cote d'Ivoire
-
 Croatia
-
 Cuba
Cuba
-
 Cyprus
-
 Czechia
-
 DR Congo
-
 Denmark
-
 Dominican Republic
-
 Ecuador
-
 Egypt
Egypt
-
 El Salvador
-
 Estonia
-
 Eswatini
-
 Ethiopia
-
 Finland
-
 France
-
 Georgia
-
 Germany
-
 Ghana
Ghana
-
 Greece
-
 Haiti
Haiti
-
 Hong Kong
-
 Hungary
-
 India
India
-
 Indonesia
-
 Iran, Islamic republic
-
 Iraq
Iraq
-
 Ireland
-
 Israel
-
 Italy
Italy
-
 Jamaica
-
 Japan
Japan
-
 Jordan
-
 Kazakhstan
-
 Kenya
Kenya
-
 Korea
Korea
-
 Kuwait
-
 Kyrgyzstan
-
 Laos
Laos
-
 Latvia
-
 Lebanon
-
 Lesotho
-
 Libya
Libya
-
 Lithuania
-
 Luxembourg
-
 Madagascar
-
 Malaysia
-
 Malta
Malta
-
 Mauritius
-
 Mexico
-
 Moldova
-
 Mongolia
-
 Montenegro
-
 Morocco
-
 Mozambique
-
 Myanmar
-
 Namibia
-
 Nepal
Nepal
-
 Netherlands
-
 New Zealand
-
 Nigeria
-
 North Macedonia
-
 Norway
-
 Oman
Oman
-
 Pakistan
-
 Palestine
-
 Panama
-
 Papua New Guinea
-
 Paraguay
-
 Peru
Peru
-
 Philippines
-
 Poland
-
 Portugal
-
 Puerto Rico
-
 Qatar
Qatar
-
 Reunion
-
 Romania
-
 Rwanda
-
 Saudi Arabia
-
 Serbia
-
 Singapore
-
 Slovakia
-
 Slovenia
-
 Somalia
-
 South Africa
-
 Spain
Spain
-
 Sri Lanka
-
 Sweden
-
 Switzerland
-
 Syria
Syria
-
 Taiwan
-
 Tajikistan
-
 Tanzania
-
 Thailand
-
 Trinidad and Tobago
-
 Tunisia
-
 Turkey
-
 UAE
UAE
-
 Uganda
-
 Ukraine
-
 United Kingdom
-
United States
-
 Uruguay
-
 Uzbekistan
-
 Venezuela
-
 Vietnam
-
 Yemen
Yemen
-
 Zambia
-
 Zimbabwe
- Forex
- Crypto
