
Gala falls with price lagging below long-term averages

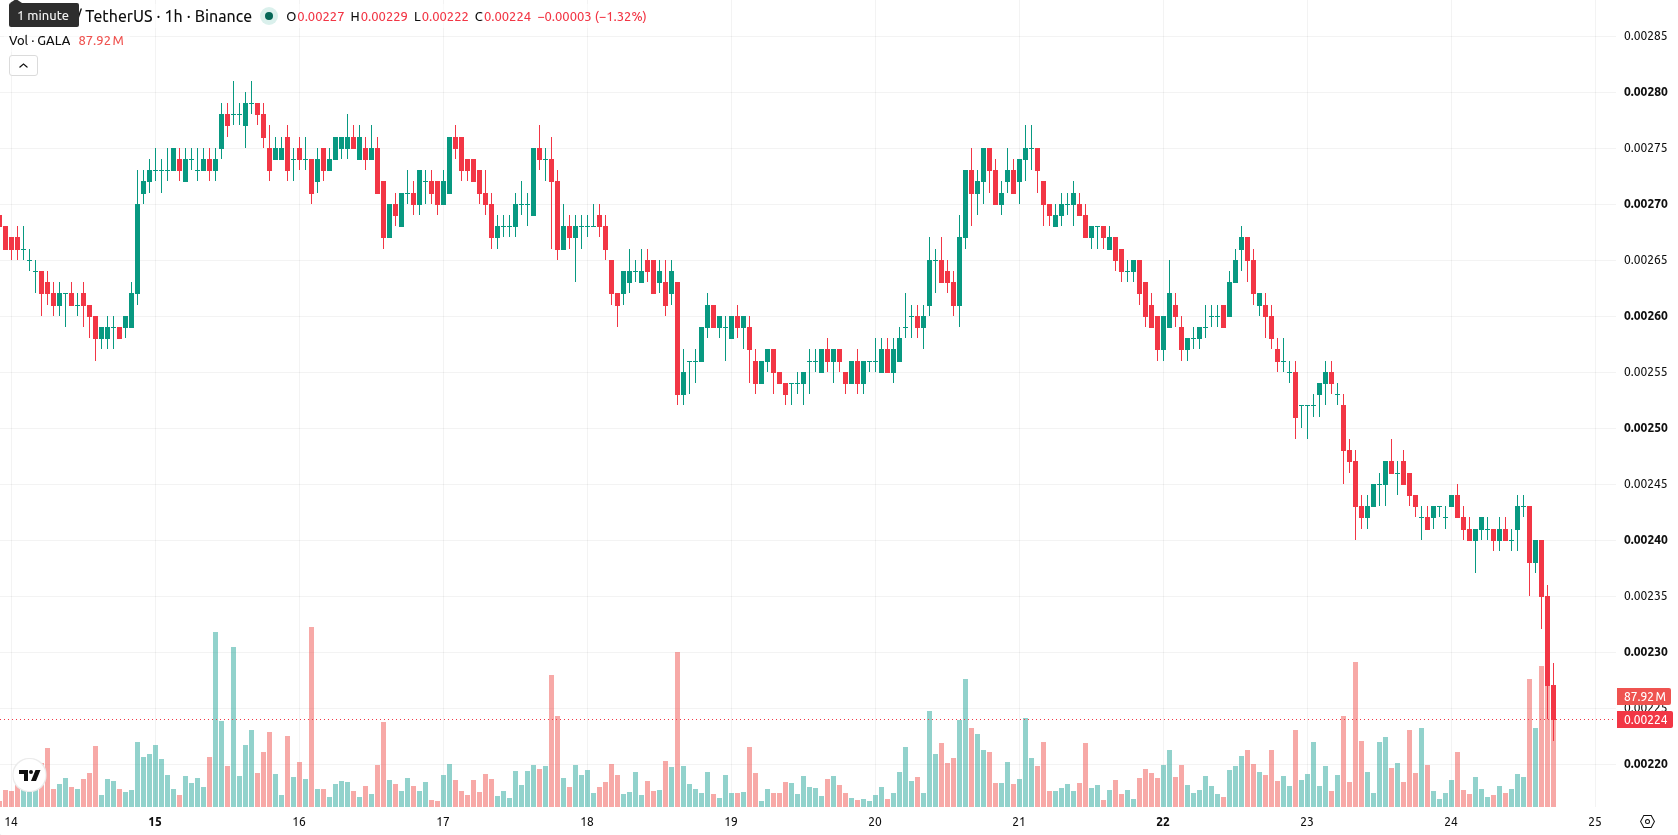
Gala (GALA) is trading at $0.00227, registering a 7.72% drop over the last 24 hours. The price remains positioned below its key moving averages, indicating continued downward momentum.
Highlights
- GALA/USD remains under pronounced bearish pressure, trading beneath key short-, medium-, and long-term moving averages.
- Momentum indicators confirm persistent sell bias and dominance of sellers, with oversold signals but no clear signs of reversal.
- Expected range for the next sessions is $0.00218727 to $0.00235273, with high downside risk if support fails.
Seller dominance reinforced by oversold indicators and key resistance
GALA/USD is trading below the 20-, 50-, and 200-period moving averages, with the latter currently at $0.002406, $0.0024622, and $0.0042732, respectively. The Ichimoku Kijun level at $0.002405 serves as immediate resistance in the current setup. Momentum indicators confirm negative sentiment: the Moving Average Convergence Divergence (MACD) remains bearish, and the Average Directional Index (ADX) signals a prevailing sell bias. The Relative Strength Index (RSI) stands at 30.60, while the Stochastic RSI and Commodity Channel Index (CCI) are both in oversold territory, pointing to potential exhaustion but not yet indicating reversal. Additional confirmation comes from Bull/Bear Power and the Awesome Oscillator, which continue to support seller dominance.
Bearish consolidation expected as volatility tightens near support
Over the next 2–3 sessions, GALA/USD is expected to trade within a volatility band of $0.00218727 to $0.00235273. Given the high probability of further downside, the short-term baseline scenario anticipates consolidation within this range. A move above $0.002405 could challenge the downtrend, while a break below $0.00218727 would reinforce bearish momentum and potentially trigger further declines.
Earlier, analysts noted that Gala was entrenched in a clear downtrend, with persistent technical weakness and limited prospects for a near-term reversal. The latest data reinforces this bearish outlook, making sustained moves above $0.002405 the critical threshold for any potential improvement in momentum.


-
 Afghanistan
-
 Albania
-
 Algeria
-
 Angola
-
 Argentina
-
 Armenia
-
 Australia
-
 Austria
-
 Azerbaijan
-
 Bahamas
-
 Bahrain
-
 Bangladesh
-
 Belarus
-
 Belgium
-
 Bolivia
-
 Botswana
-
 Brazil
-
 Brunei
-
 Bulgaria
-
 Cambodia
-
 Cameroon
-
 Canada
-
 Chile
Chile
-
 China
China
-
 Colombia
-
 Congo
Congo
-
 Costa Rica
-
 Cote d'Ivoire
-
 Croatia
-
 Cuba
Cuba
-
 Cyprus
-
 Czechia
-
 DR Congo
-
 Denmark
-
 Dominican Republic
-
 Ecuador
-
 Egypt
Egypt
-
 El Salvador
-
 Estonia
-
 Eswatini
-
 Ethiopia
-
 Finland
-
 France
-
 Georgia
-
 Germany
-
 Ghana
Ghana
-
 Greece
-
 Haiti
Haiti
-
 Hong Kong
-
 Hungary
-
 India
India
-
 Indonesia
-
 Iran, Islamic republic
-
 Iraq
Iraq
-
 Ireland
-
 Israel
-
 Italy
Italy
-
 Jamaica
-
 Japan
Japan
-
 Jordan
-
 Kazakhstan
-
 Kenya
Kenya
-
 Korea
Korea
-
 Kuwait
-
 Kyrgyzstan
-
 Laos
Laos
-
 Latvia
-
 Lebanon
-
 Lesotho
-
 Libya
Libya
-
 Lithuania
-
 Luxembourg
-
 Madagascar
-
 Malaysia
-
 Malta
Malta
-
 Mauritius
-
 Mexico
-
 Moldova
-
 Mongolia
-
 Montenegro
-
 Morocco
-
 Mozambique
-
 Myanmar
-
 Namibia
-
 Nepal
Nepal
-
 Netherlands
-
 New Zealand
-
 Nigeria
-
 North Macedonia
-
 Norway
-
 Oman
Oman
-
 Pakistan
-
 Palestine
-
 Panama
-
 Papua New Guinea
-
 Paraguay
-
 Peru
Peru
-
 Philippines
-
 Poland
-
 Portugal
-
 Puerto Rico
-
 Qatar
Qatar
-
 Reunion
-
 Romania
-
 Rwanda
-
 Saudi Arabia
-
 Serbia
-
 Singapore
-
 Slovakia
-
 Slovenia
-
 Somalia
-
 South Africa
-
 Spain
Spain
-
 Sri Lanka
-
 Sweden
-
 Switzerland
-
 Syria
Syria
-
 Taiwan
-
 Tajikistan
-
 Tanzania
-
 Thailand
-
 Trinidad and Tobago
-
 Tunisia
-
 Turkey
-
 UAE
UAE
-
 Uganda
-
 Ukraine
-
 United Kingdom
-
United States
-
 Uruguay
-
 Uzbekistan
-
 Venezuela
-
 Vietnam
-
 Yemen
Yemen
-
 Zambia
-
 Zimbabwe
- Forex
- Crypto
