
Bonk tumbles as market cap slips under crucial $500 million mark

Bonk (BONK) is trading at $0.0000043, marking a daily drop of 10.13%. The price currently sits below its key moving averages, indicating a continuation of the short-term downtrend.
 0.0550
0.05516
0.0550
0.05516
Highlights
- Bonk's market cap fell below $500 million, undermining investor confidence and diminishing its market prominence.
- Trading volume surged to $59 million, 63% above the 30-day average, signaling heightened volatility and aggressive liquidity shifts.
- Technicals show persistent bearish momentum with consolidation likely between $0.00000404 and $0.00000467 over the next 2-3 days.
Confidence weakens as capitalization drops amid trading volume surge
Bonk's market capitalization recently dropped below the $500 million mark, a reduction that diminishes the token's profile and can erode both institutional and trader confidence. At the same time, according to provided data, trading volumes on Bonk surged to $59 million, standing 63% above the 30-day average and reflecting intensified market participation. This jump in activity points to elevated volatility and a potential acceleration of ongoing trends, as shifting liquidity may amplify both upward and downward pressures in the short term.
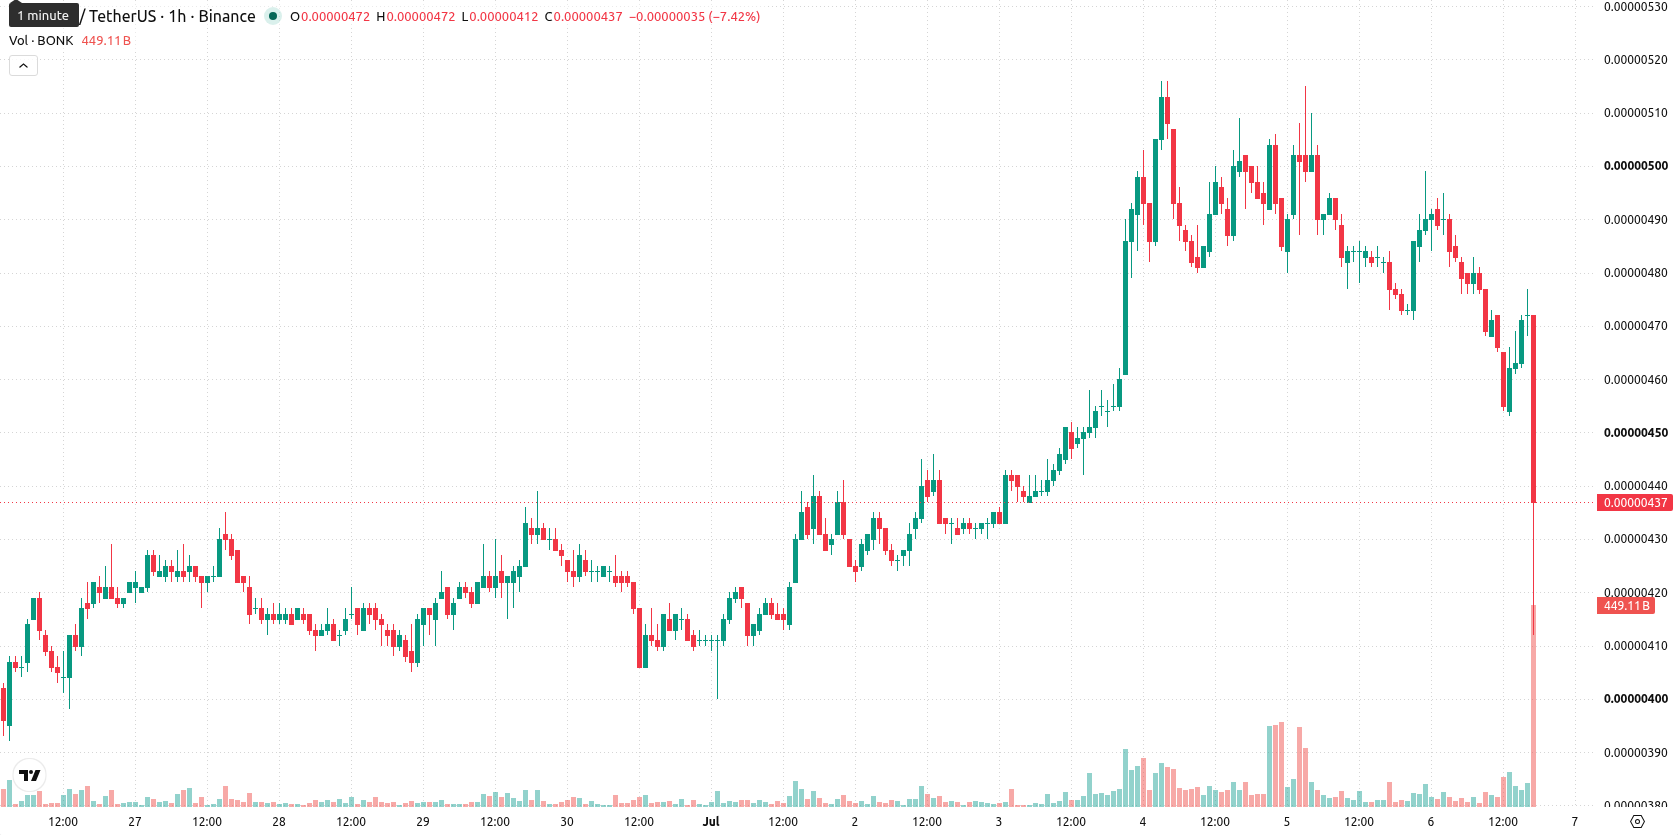
Mixed momentum signals as price tests resistance amid volatility
On the hourly chart, BONK remains below the 20-period moving average at $0.00000477 and the 50-period moving average at $0.00000485, while also trading well below the 200-period moving average at $0.00000656 on the daily timeframe. The Ichimoku Kijun level at $0.00000476 currently acts as immediate resistance. Momentum indicators are mixed: the Moving Average Convergence Divergence (MACD) and the Relative Strength Index (RSI) at 46.18 both signal a downside bias, while the Average Directional Index (ADX), Commodity Channel Index (CCI), and Awesome Oscillator remain neutral. The Stochastic RSI is in overbought territory, suggesting some potential for a short-term bounce, and Bull/Bear Power displays strong intraday buyer dominance. Notably, the current price sits near the daily low with volatility remaining elevated, underlining a divergence between short-term buyer activity and the broader negative trend.
Moderate upward bias as consolidation faces resistance and support risks
Over the next two to three trading days, BONK is expected to consolidate within a typical volatility band ranging from $0.00000404 to $0.00000467. The probability of an upward move stands at 55%, slightly higher than the 45% chance of further decline, indicating a moderate upward tilt but not a decisive trend reversal. If BONK breaks above the $0.00000476 Kijun resistance, it could accelerate towards the upper end of the range; failure to hold above the lower support at $0.00000404 would risk renewed selling pressure.
Earlier, analysts noted that BONK’s momentum was primarily driven by short-lived speculative trading activity amid persistent sell-side pressure. The recent surge in trading volumes despite continued price weakness adds a layer of heightened volatility, making any decisive move above or below the $0.00000476 and $0.00000404 levels a critical signal for traders in the near term.














-
 Afghanistan
-
 Albania
-
 Algeria
-
 Angola
-
 Argentina
-
 Armenia
-
 Australia
-
 Austria
-
 Azerbaijan
-
 Bahamas
-
 Bahrain
-
 Bangladesh
-
 Belarus
-
 Belgium
-
 Bolivia
-
 Botswana
-
 Brazil
-
 Brunei
-
 Bulgaria
-
 Cambodia
-
 Cameroon
-
 Canada
-
 Chile
Chile
-
 China
China
-
 Colombia
-
 Congo
Congo
-
 Costa Rica
-
 Cote d'Ivoire
-
 Croatia
-
 Cuba
Cuba
-
 Cyprus
-
 Czechia
-
 DR Congo
-
 Denmark
-
 Dominican Republic
-
 Ecuador
-
 Egypt
Egypt
-
 El Salvador
-
 Estonia
-
 Eswatini
-
 Ethiopia
-
 Finland
-
 France
-
 Georgia
-
 Germany
-
 Ghana
Ghana
-
 Greece
-
 Haiti
Haiti
-
 Hong Kong
-
 Hungary
-
 India
India
-
 Indonesia
-
 Iran, Islamic republic
-
 Iraq
Iraq
-
 Ireland
-
 Israel
-
 Italy
Italy
-
 Jamaica
-
 Japan
Japan
-
 Jordan
-
 Kazakhstan
-
 Kenya
Kenya
-
 Korea
Korea
-
 Kuwait
-
 Kyrgyzstan
-
 Laos
Laos
-
 Latvia
-
 Lebanon
-
 Lesotho
-
 Libya
Libya
-
 Lithuania
-
 Luxembourg
-
 Madagascar
-
 Malaysia
-
 Malta
Malta
-
 Mauritius
-
 Mexico
-
 Moldova
-
 Mongolia
-
 Montenegro
-
 Morocco
-
 Mozambique
-
 Myanmar
-
 Namibia
-
 Nepal
Nepal
-
 Netherlands
-
 New Zealand
-
 Nigeria
-
 North Macedonia
-
 Norway
-
 Oman
Oman
-
 Pakistan
-
 Palestine
-
 Panama
-
 Papua New Guinea
-
 Paraguay
-
 Peru
Peru
-
 Philippines
-
 Poland
-
 Portugal
-
 Puerto Rico
-
 Qatar
Qatar
-
 Reunion
-
 Romania
-
 Rwanda
-
 Saudi Arabia
-
 Serbia
-
 Singapore
-
 Slovakia
-
 Slovenia
-
 Somalia
-
 South Africa
-
 Spain
Spain
-
 Sri Lanka
-
 Sweden
-
 Switzerland
-
 Syria
Syria
-
 Taiwan
-
 Tajikistan
-
 Tanzania
-
 Thailand
-
 Trinidad and Tobago
-
 Tunisia
-
 Turkey
-
 UAE
UAE
-
 Uganda
-
 Ukraine
-
 United Kingdom
-
United States
-
 Uruguay
-
 Uzbekistan
-
 Venezuela
-
 Vietnam
-
 Yemen
Yemen
-
 Zambia
-
 Zimbabwe
- Forex
- Crypto











