
Bitcoin stays under pressure as spot Bitcoin ETF outflows persist

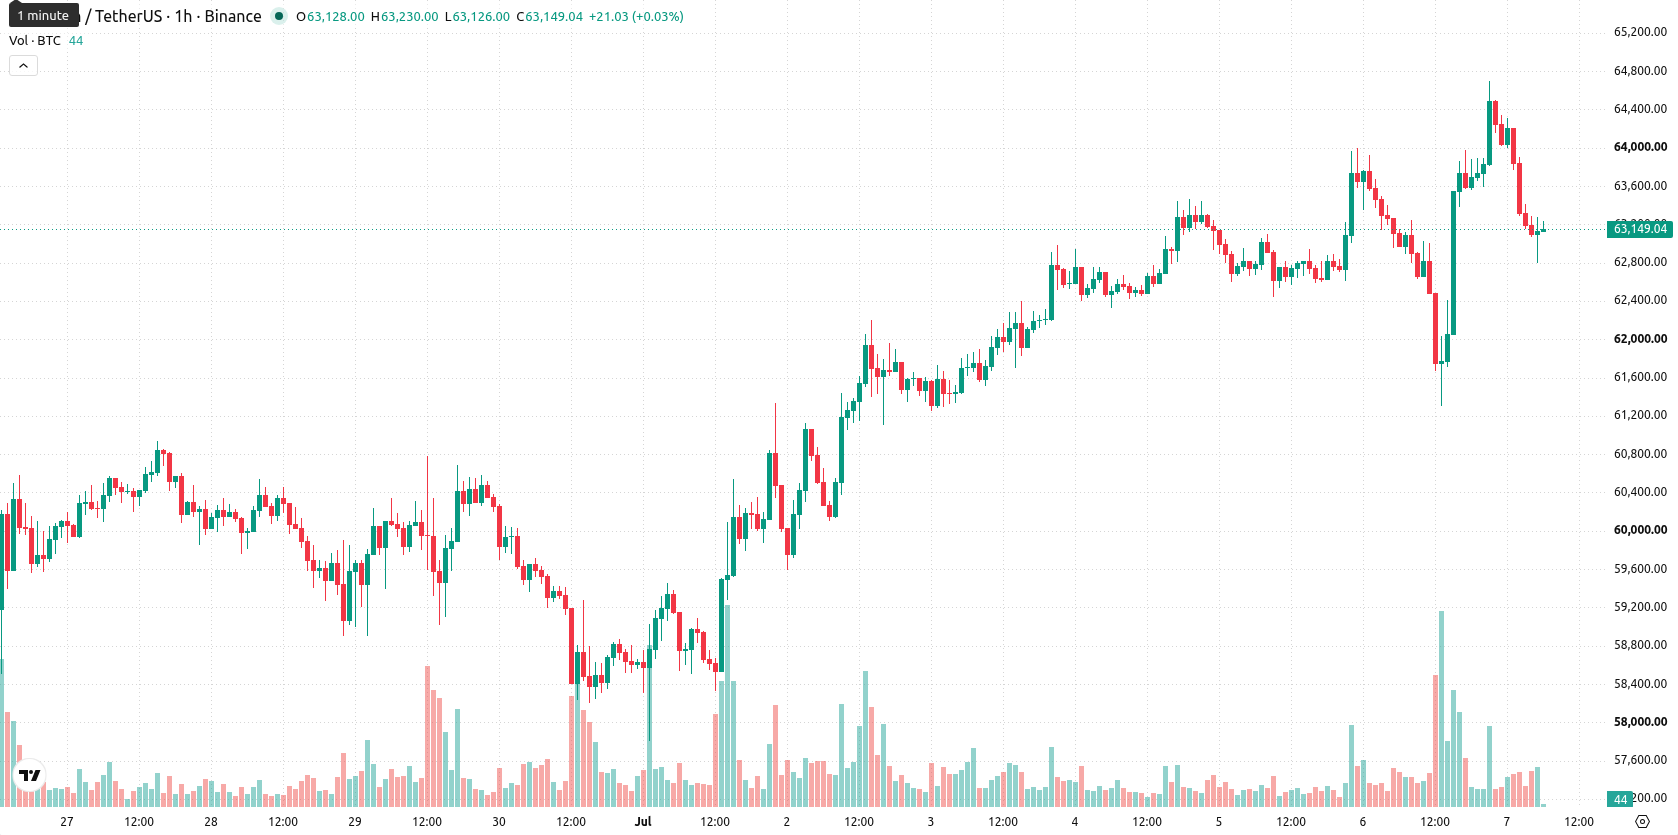
Bitcoin (BTC) is trading at $63,126, little changed from the previous close and reflecting a marginal daily move. The price is currently below key short-term moving averages, indicating mixed short- and medium-term positioning.
 63761.99
64700.00
63761.99
64700.00
Highlights
- Strategy sold 3,588 Bitcoin for $216 million to fund dividends and boost cash reserves, increasing near-term market supply.
- Despite the sale, Strategy retains 843,775 BTC and $2.55 billion in cash, even as unrealized digital asset losses reached $8.32 billion in Q2 2026.
- Bitcoin trading shows sideways consolidation between $61,583 and $64,668 amid mixed momentum signals and ongoing institutional ETF outflows.
Asset sales and sustained outflows reinforce institutional caution
Strategy's sale of 3,588 Bitcoin for $216 million between June 29 and July 5, 2026, as reported by The Block, added short-term supply to the market as the company liquidated assets to fund preferred stock dividends and boost its USD reserve. The firm's post-transaction holdings stood at 843,775 BTC and $2.55 billion in cash, also according to The Block, highlighting its continued significant presence in the market following the sale. Additionally, Strategy reported $8.32 billion in unrealized digital asset losses for the second quarter of 2026 due to Bitcoin trading below its purchase cost, according to Benzinga. Meanwhile, data from Bitcoinfoundation showed that U.S.-listed spot Bitcoin ETFs marked an eighth consecutive week of outflows, with $8.2 billion withdrawn since May, underscoring ongoing institutional caution toward Bitcoin exposure.
Support and resistance define range as indicators show indecision
On the technical front, the price is positioned below the Simple Moving Average (SMA)-20 and above the SMA-50 on the H1 timeframe, while remaining well below the long-term SMA-200. The Ichimoku Kijun at $63,003 acts as immediate support. The expected near-term range is defined by this support at $63,003 and resistance around $64,668. Among indicator readings, the Moving Average Convergence Divergence (MACD) points to strong buying, while the Average Directional Index (ADX) is neutral. The Relative Strength Index (RSI) signals a sell bias, with Stochastic RSI and Bull/Bear Power both indicating oversold conditions and dominant selling pressure. The Commodity Channel Index (CCI) is neutral, and the Awesome Oscillator provides no clear directional cue. This mix of signals emphasizes indecision and range-bound trade conditions.
Balanced scenario as volatility range limits directional conviction
Looking ahead, Bitcoin is expected to oscillate within a band of $61,583 to $64,668 over the coming days, which reflects a typical volatility range relative to current levels. Both bullish and bearish scenarios are evenly balanced at 50%, with no clear directional bias at present. Sideways consolidation remains the baseline outlook unless price action breaks above resistance at $64,668 or falls below immediate support at $63,003, which would trigger a directional move.
Previously, it was reported that persistent outflows from spot Bitcoin ETFs and notable corporate sales had weighed heavily on market sentiment, highlighting lingering institutional caution around Bitcoin exposure. With current indicators revealing heightened volatility and indecision, traders should closely monitor for a sustained break above $64,668 or below $63,003 for clues to the next directional move.





Latest Bitcoin News









-
 Afghanistan
-
 Albania
-
 Algeria
-
 Angola
-
 Argentina
-
 Armenia
-
 Australia
-
 Austria
-
 Azerbaijan
-
 Bahamas
-
 Bahrain
-
 Bangladesh
-
 Belarus
-
 Belgium
-
 Bolivia
-
 Botswana
-
 Brazil
-
 Brunei
-
 Bulgaria
-
 Cambodia
-
 Cameroon
-
 Canada
-
 Chile
Chile
-
 China
China
-
 Colombia
-
 Congo
Congo
-
 Costa Rica
-
 Cote d'Ivoire
-
 Croatia
-
 Cuba
Cuba
-
 Cyprus
-
 Czechia
-
 DR Congo
-
 Denmark
-
 Dominican Republic
-
 Ecuador
-
 Egypt
Egypt
-
 El Salvador
-
 Estonia
-
 Eswatini
-
 Ethiopia
-
 Finland
-
 France
-
 Georgia
-
 Germany
-
 Ghana
Ghana
-
 Greece
-
 Haiti
Haiti
-
 Hong Kong
-
 Hungary
-
 India
India
-
 Indonesia
-
 Iran, Islamic republic
-
 Iraq
Iraq
-
 Ireland
-
 Israel
-
 Italy
Italy
-
 Jamaica
-
 Japan
Japan
-
 Jordan
-
 Kazakhstan
-
 Kenya
Kenya
-
 Korea
Korea
-
 Kuwait
-
 Kyrgyzstan
-
 Laos
Laos
-
 Latvia
-
 Lebanon
-
 Lesotho
-
 Libya
Libya
-
 Lithuania
-
 Luxembourg
-
 Madagascar
-
 Malaysia
-
 Malta
Malta
-
 Mauritius
-
 Mexico
-
 Moldova
-
 Mongolia
-
 Montenegro
-
 Morocco
-
 Mozambique
-
 Myanmar
-
 Namibia
-
 Nepal
Nepal
-
 Netherlands
-
 New Zealand
-
 Nigeria
-
 North Macedonia
-
 Norway
-
 Oman
Oman
-
 Pakistan
-
 Palestine
-
 Panama
-
 Papua New Guinea
-
 Paraguay
-
 Peru
Peru
-
 Philippines
-
 Poland
-
 Portugal
-
 Puerto Rico
-
 Qatar
Qatar
-
 Reunion
-
 Romania
-
 Rwanda
-
 Saudi Arabia
-
 Serbia
-
 Singapore
-
 Slovakia
-
 Slovenia
-
 Somalia
-
 South Africa
-
 Spain
Spain
-
 Sri Lanka
-
 Sweden
-
 Switzerland
-
 Syria
Syria
-
 Taiwan
-
 Tajikistan
-
 Tanzania
-
 Thailand
-
 Trinidad and Tobago
-
 Tunisia
-
 Turkey
-
 UAE
UAE
-
 Uganda
-
 Ukraine
-
 United Kingdom
-
United States
-
 Uruguay
-
 Uzbekistan
-
 Venezuela
-
 Vietnam
-
 Yemen
Yemen
-
 Zambia
-
 Zimbabwe
- Forex
- Crypto











