

Stellar (XLM) is trading at $0.1881 after falling 7.16% in the past 24 hours. The token sits below its key short- and medium-term moving averages, but holds above longer-term support levels.
 0.1893
0.2157
0.1893
0.2157
Highlights
- Tokenized real-world assets on Stellar have exceeded $3 billion, signaling robust on-chain growth and institutional adoption.
- The UNDP expanded its partnership with Stellar after pilots reduced aid distribution costs from 10% to 2% and improved reliability.
- XLM technical signals indicate strong near-term bearish momentum, with expected price consolidation between $0.1822 and $0.2091 and high downside risk.
Tokenized asset growth and protocol upgrade plans support long-term adoption
The total value of real-world assets tokenized on the Stellar network exceeded $3 billion, a milestone highlighted by Coin Turk that demonstrates sizable on-chain growth and rising adoption for tokenized financial products. Separately, the United Nations Development Programme expanded its partnership with the Stellar Development Foundation after pilots using Stellar’s blockchain technology reduced aid distribution costs from 10% to 2% and improved payment reliability, according to Crypto, reinforcing Stellar’s appeal for enterprise-grade applications. Additionally, Livebitcoinnews reported that network validators are scheduled to decide on Protocol 27 ('Zipper'), an upgrade aimed at implementing native delegation and enhanced account security, introducing further potential for protocol improvements — though price action has remained under broader selling pressure.
Heavy sell momentum as technical signals confirm oversold stretch
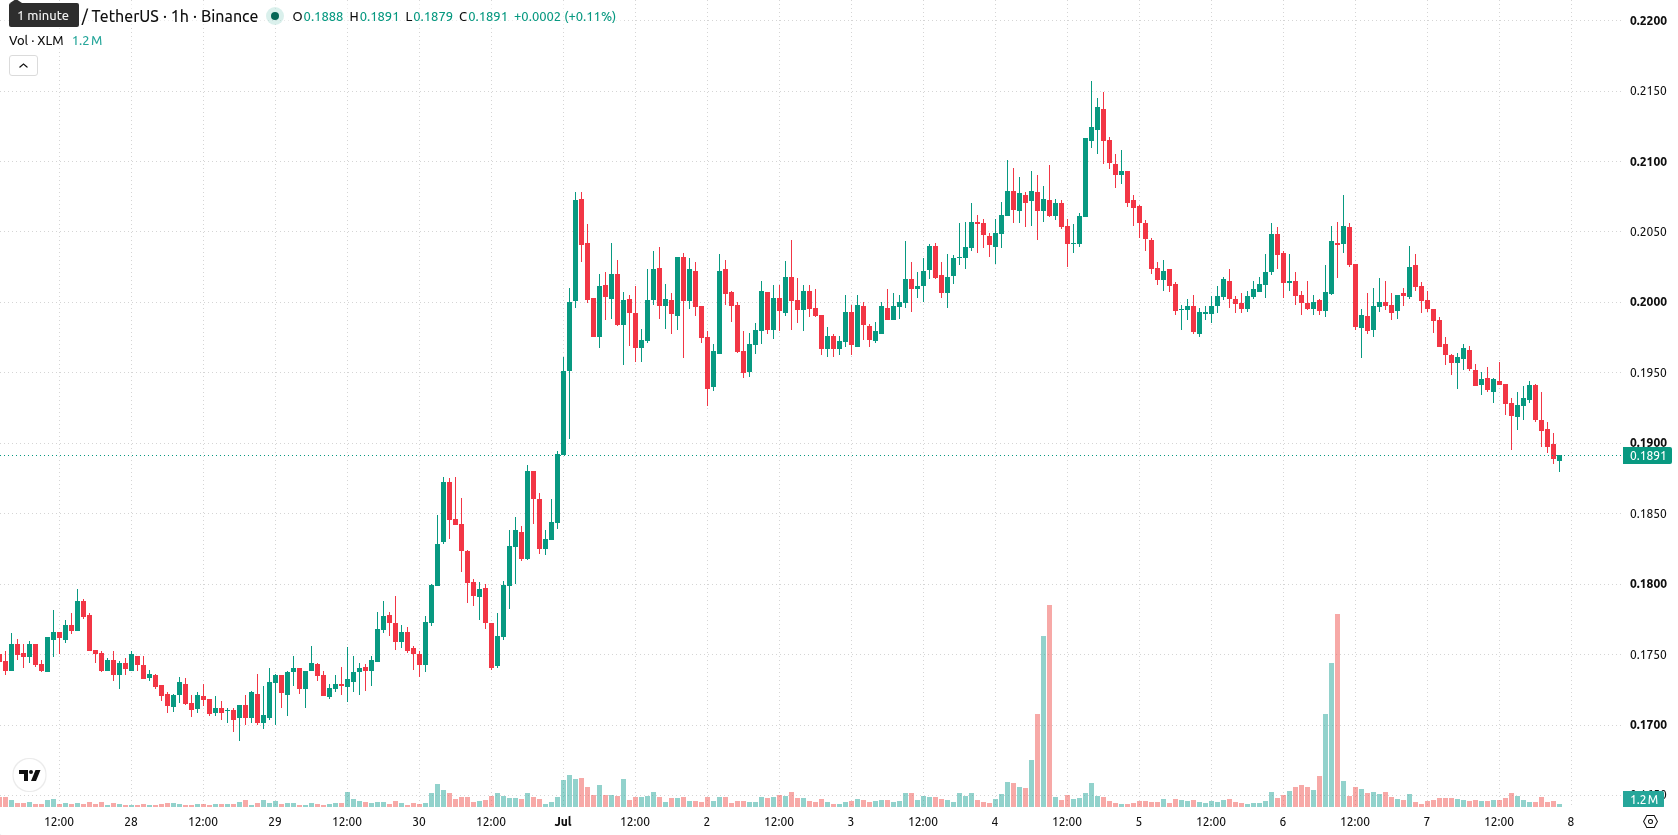
On the hourly chart, XLM/USD trades below the 20-period and 50-period moving averages, while remaining above the 200-period moving average. The Ichimoku Kijun provides immediate resistance at $0.1963. Momentum indicators reflect pronounced negative pressure: the Moving Average Convergence Divergence (MACD) and Average Directional Index (ADX) confirm sustained selling, the Relative Strength Index (RSI) sits at 27 in a strong sell region, and both the Commodity Channel Index (CCI) and Stochastic RSI indicate oversold conditions. Bull/Bear Power shows sellers controlling intraday direction, while the Awesome Oscillator remains neutral and does not reinforce the dominant trend.
Downside risk elevated amid resistance and likely volatile consolidation
XLM is expected to trade in a volatile band between $0.1822 and $0.2091 over the short term. The probability of a further downward move is very high, while an upside rebound remains unlikely without a catalyst. The baseline scenario suggests a period of sideways consolidation within this range, with any bullish move requiring a breakout above the immediate resistance at $0.1963. A drop below $0.1822 would open additional short-term downside risk.
Earlier, analysts noted that renewed institutional adoption and ongoing ecosystem innovation were underpinning a cautiously bullish outlook for Stellar despite residual technical headwinds. However, recent downside momentum, combined with oversold technical signals and network milestones, now suggests traders should closely watch for a potential volatility spike around the $0.1822 support level as the next directional trigger.











-
 Afghanistan
-
 Albania
-
 Algeria
-
 Angola
-
 Argentina
-
 Armenia
-
 Australia
-
 Austria
-
 Azerbaijan
-
 Bahamas
-
 Bahrain
-
 Bangladesh
-
 Belarus
-
 Belgium
-
 Bolivia
-
 Botswana
-
 Brazil
-
 Brunei
-
 Bulgaria
-
 Cambodia
-
 Cameroon
-
 Canada
-
 Chile
Chile
-
 China
China
-
 Colombia
-
 Congo
Congo
-
 Costa Rica
-
 Cote d'Ivoire
-
 Croatia
-
 Cuba
Cuba
-
 Cyprus
-
 Czechia
-
 DR Congo
-
 Denmark
-
 Dominican Republic
-
 Ecuador
-
 Egypt
Egypt
-
 El Salvador
-
 Estonia
-
 Eswatini
-
 Ethiopia
-
 Finland
-
 France
-
 Georgia
-
 Germany
-
 Ghana
Ghana
-
 Greece
-
 Haiti
Haiti
-
 Hong Kong
-
 Hungary
-
 India
India
-
 Indonesia
-
 Iran, Islamic republic
-
 Iraq
Iraq
-
 Ireland
-
 Israel
-
 Italy
Italy
-
 Jamaica
-
 Japan
Japan
-
 Jordan
-
 Kazakhstan
-
 Kenya
Kenya
-
 Korea
Korea
-
 Kuwait
-
 Kyrgyzstan
-
 Laos
Laos
-
 Latvia
-
 Lebanon
-
 Lesotho
-
 Libya
Libya
-
 Lithuania
-
 Luxembourg
-
 Madagascar
-
 Malaysia
-
 Malta
Malta
-
 Mauritius
-
 Mexico
-
 Moldova
-
 Mongolia
-
 Montenegro
-
 Morocco
-
 Mozambique
-
 Myanmar
-
 Namibia
-
 Nepal
Nepal
-
 Netherlands
-
 New Zealand
-
 Nigeria
-
 North Macedonia
-
 Norway
-
 Oman
Oman
-
 Pakistan
-
 Palestine
-
 Panama
-
 Papua New Guinea
-
 Paraguay
-
 Peru
Peru
-
 Philippines
-
 Poland
-
 Portugal
-
 Puerto Rico
-
 Qatar
Qatar
-
 Reunion
-
 Romania
-
 Rwanda
-
 Saudi Arabia
-
 Serbia
-
 Singapore
-
 Slovakia
-
 Slovenia
-
 Somalia
-
 South Africa
-
 Spain
Spain
-
 Sri Lanka
-
 Sweden
-
 Switzerland
-
 Syria
Syria
-
 Taiwan
-
 Tajikistan
-
 Tanzania
-
 Thailand
-
 Trinidad and Tobago
-
 Tunisia
-
 Turkey
-
 UAE
UAE
-
 Uganda
-
 Ukraine
-
 United Kingdom
-
United States
-
 Uruguay
-
 Uzbekistan
-
 Venezuela
-
 Vietnam
-
 Yemen
Yemen
-
 Zambia
-
 Zimbabwe
- Forex
- Crypto











