

PEPE weekly forecast: Bearish momentum dominates with price action trapped below key moving averages

Pepe (PEPE) is trading near $0.0000026 following a sharp move down of about 6% over the past week, with decline pressure intensifying as the token stretches into oversold territory. Institutional activity and speculation around new investment vehicles have influenced sentiment, positioning bearish momentum at the forefront for the days ahead.
 0.0542
0.054330
0.0542
0.054330
Highlights
- Pepe fell 6.05% over the past week and trades near the bottom of its recent range at $0.0000026.
- Momentum and volatility indicators on the daily chart signal a bearish bias, with price action below key moving averages.
- Pepe is projected to consolidate between $0.00000242 and $0.000002779 over the next 7 days, with sellers in control below $0.00000262.
Institutional flows shift as ETF news and whale activity clash with meme coin fatigue
A spot PEPE ETF filing submitted to the SEC in late May 2026 drew increased institutional attention to PEPE, with investors closely watching for regulatory developments, according to several crypto-focused outlets. DiarioBitcoin reported that Pepe broke key support levels amid a waning interest in meme coins after the 2024 rally, contributing to a notable year-over-year pullback. On-chain data also highlighted continued whale accumulation of PEPE tokens, suggesting that some larger players remain active even as the overall mood stays bearish.
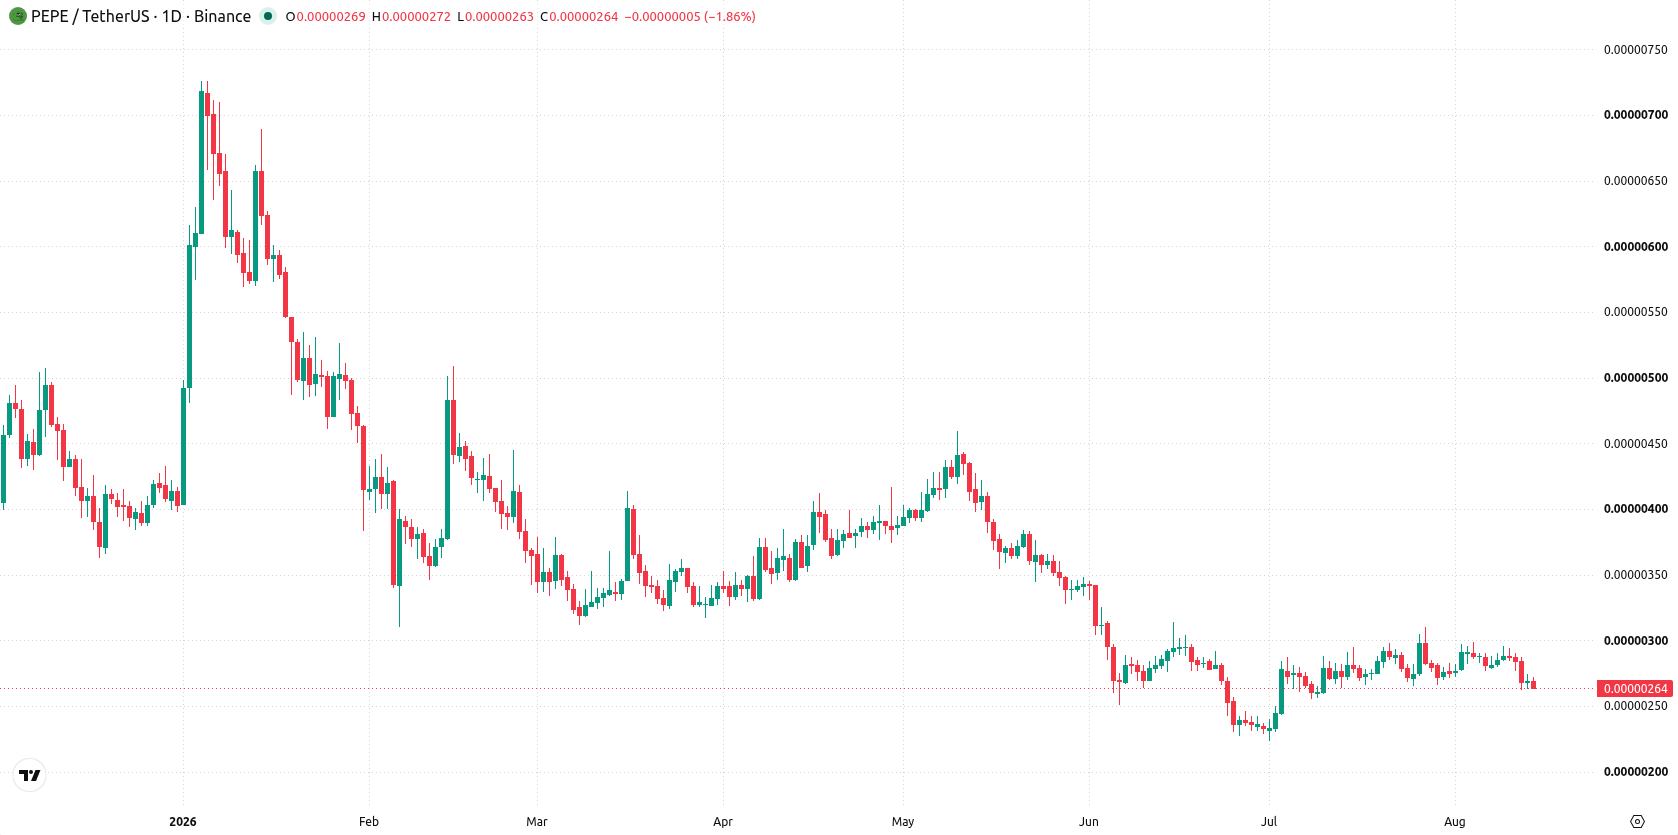
Bearish technicals dominate this week as volatility fails to sustain trend shifts
On the daily chart, the structure is heavy, with price action remaining decisively beneath major moving averages and volatility over the past 7 days at 12.98%. Momentum signals present a bearish bias: CCI is in the oversold zone at -147.829207033 while Stochastic RSI is also oversold at 5.058712237. The Awesome Oscillator aligns with this tone, forecasting a strong sell. The nearest resistance is at $0.00000262, while the Ichimoku Kijun at $0.00000286 acts as additional resistance. The current setup signals that the recent sharp move lower lacks the follow-through to establish a sustained trend.
Bearish bias prevails for the coming week amid high downside breakout risk
Over the next 7 days, Pepe is expected to trade within a range of $0.00000242 to $0.000002779. There is a very high probability (more than 80%) of a decrease and a very low probability (less than 20%) of an increase. The base case is further consolidation between support and resistance, with sellers maintaining control below $0.00000262. A move above the $0.00000262 resistance could trigger a quick retest of the $0.000002779 upper bound, while a decisive drop below $0.00000242 would signal a clear break to the downside.
Earlier, analysts noted that regulatory developments and rising institutional interest were bringing new focus to Pepe after a period of cautious consolidation. The current outlook signals that persistent selling pressure and a pronounced move into oversold territory have shifted the prevailing risk to the downside, making $0.00000242 the key support level to watch for potential breakdown or rebound scenarios in the days ahead.










-
 Afghanistan
-
 Albania
-
 Algeria
-
 Angola
-
 Argentina
-
 Armenia
-
 Australia
-
 Austria
-
 Azerbaijan
-
 Bahamas
-
 Bahrain
-
 Bangladesh
-
 Belarus
-
 Belgium
-
 Bolivia
-
 Botswana
-
 Brazil
-
 Brunei
-
 Bulgaria
-
 Cambodia
-
 Cameroon
-
 Canada
-
 Chile
Chile
-
 China
China
-
 Colombia
-
 Congo
Congo
-
 Costa Rica
-
 Cote d'Ivoire
-
 Croatia
-
 Cuba
Cuba
-
 Cyprus
-
 Czechia
-
 DR Congo
-
 Denmark
-
 Dominican Republic
-
 Ecuador
-
 Egypt
Egypt
-
 El Salvador
-
 Estonia
-
 Eswatini
-
 Ethiopia
-
 Finland
-
 France
-
 Georgia
-
 Germany
-
 Ghana
Ghana
-
 Greece
-
 Haiti
Haiti
-
 Hong Kong
-
 Hungary
-
 India
India
-
 Indonesia
-
 Iran, Islamic republic
-
 Iraq
Iraq
-
 Ireland
-
 Israel
-
 Italy
Italy
-
 Jamaica
-
 Japan
Japan
-
 Jordan
-
 Kazakhstan
-
 Kenya
Kenya
-
 Korea
Korea
-
 Kuwait
-
 Kyrgyzstan
-
 Laos
Laos
-
 Latvia
-
 Lebanon
-
 Lesotho
-
 Libya
Libya
-
 Lithuania
-
 Luxembourg
-
 Madagascar
-
 Malaysia
-
 Malta
Malta
-
 Mauritius
-
 Mexico
-
 Moldova
-
 Mongolia
-
 Montenegro
-
 Morocco
-
 Mozambique
-
 Myanmar
-
 Namibia
-
 Nepal
Nepal
-
 Netherlands
-
 New Zealand
-
 Nigeria
-
 North Macedonia
-
 Norway
-
 Oman
Oman
-
 Pakistan
-
 Palestine
-
 Panama
-
 Papua New Guinea
-
 Paraguay
-
 Peru
Peru
-
 Philippines
-
 Poland
-
 Portugal
-
 Puerto Rico
-
 Qatar
Qatar
-
 Reunion
-
 Romania
-
 Rwanda
-
 Saudi Arabia
-
 Serbia
-
 Singapore
-
 Slovakia
-
 Slovenia
-
 Somalia
-
 South Africa
-
 Spain
Spain
-
 Sri Lanka
-
 Sweden
-
 Switzerland
-
 Syria
Syria
-
 Taiwan
-
 Tajikistan
-
 Tanzania
-
 Thailand
-
 Trinidad and Tobago
-
 Tunisia
-
 Turkey
-
 UAE
UAE
-
 Uganda
-
 Ukraine
-
 United Kingdom
-
United States
-
 Uruguay
-
 Uzbekistan
-
 Venezuela
-
 Vietnam
-
 Yemen
Yemen
-
 Zambia
-
 Zimbabwe
- Forex
- Crypto












