

Quant weekly forecast: Bearish momentum dominates with sellers pressing support zones

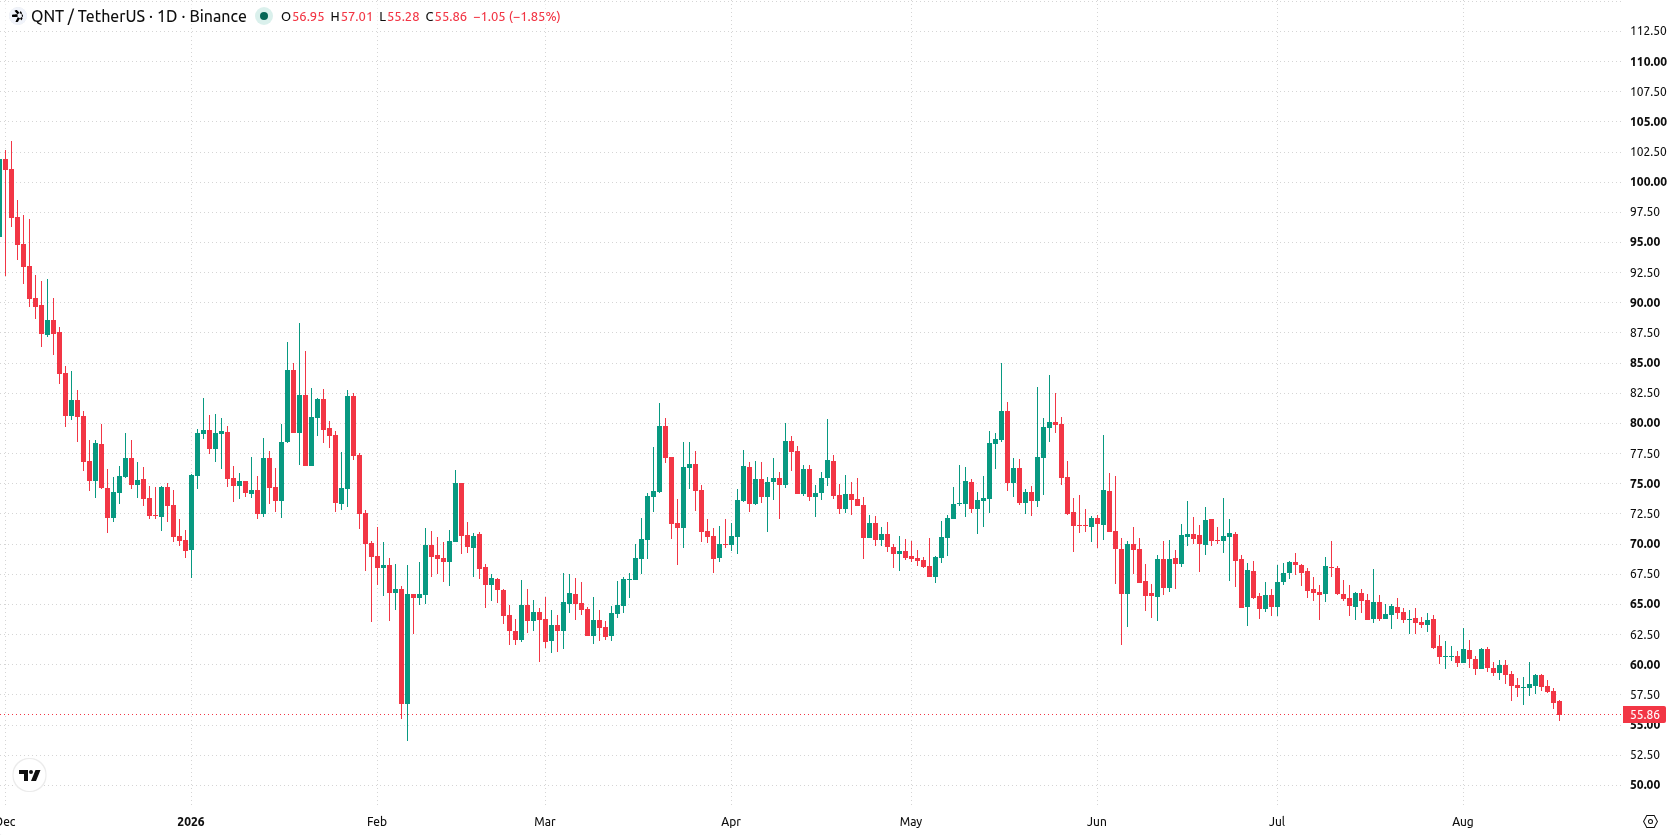
Quant (QNT) is trading near $56 after a drop of a little more than 4% over the past week, as stretched declines pull support zones into focus. With bearish momentum still in control, sellers keep pressing, and the next move hinges on whether support can hold in the days ahead.
 200.58
208.670000
Highlights
- Quant trades at $55.86 after a 4.09% drop over 7 days, staying below its key moving averages.
- Technical momentum remains negative, with the price near oversold levels and no clear daily support identified.
- Quant is projected to trade between $53.63 and $57.95 this week, with a 77% probability of further decline.
Oversold technical signals persist as tight weekly range contains downside
On the daily chart, the structure remains negative with momentum weak and the 7.02% weekly volatility highlighting a contained move within a narrow range. RSI is approaching oversold at 30.7376 and the Stochastic RSI is fully oversold, while MACD remains in sell territory, reinforcing downside pressure. Immediate resistance is at $56.25, with the Ichimoku Kijun at $60.445 acting as a higher cap, and there is no clear daily support nearby.
Consolidation likely next week as bearish bias limits upside scenarios
In the week ahead, Quant is expected to trade between $53.63 and $57.950143, with a 23% probability of an increase and a 77% probability of a decrease. The base case is continued consolidation below resistance at $56.25, reflecting prevailing bearish momentum. A break above $56.25 could see buyers testing $57.95, but sustained gains would need a move through the Kijun at $60.445. If sellers drive the price under $53.63, downside risk will accelerate in line with the dominant negative bias.
Earlier, analysts noted that Quant remained under sustained bearish pressure with downside risks persisting amid a narrowly contained range. The current analysis reinforces this outlook with fresh technical evidence, highlighting $53.63 as the key level to watch for further downside acceleration if sellers maintain control.











-
 Afghanistan
-
 Albania
-
 Algeria
-
 Angola
-
 Argentina
-
 Armenia
-
 Australia
-
 Austria
-
 Azerbaijan
-
 Bahamas
-
 Bahrain
-
 Bangladesh
-
 Belarus
-
 Belgium
-
 Bolivia
-
 Botswana
-
 Brazil
-
 Brunei
-
 Bulgaria
-
 Cambodia
-
 Cameroon
-
 Canada
-
 Chile
-
 China
-
 Colombia
-
 Congo
-
 Costa Rica
-
 Cote d'Ivoire
-
 Croatia
-
 Cuba
-
 Cyprus
-
 Czechia
-
 DR Congo
-
 Denmark
-
 Dominican Republic
-
 Ecuador
-
 Egypt
-
 El Salvador
-
 Estonia
-
 Eswatini
-
 Ethiopia
-
 Finland
-
 France
-
 Georgia
-
 Germany
-
 Ghana
-
 Greece
-
 Haiti
-
 Hong Kong
-
 Hungary
-
 India
-
 Indonesia
-
 Iran, Islamic republic
-
 Iraq
-
 Ireland
-
 Israel
-
 Italy
-
 Jamaica
-
 Japan
-
 Jordan
-
 Kazakhstan
-
 Kenya
-
 Korea
-
 Kuwait
-
 Kyrgyzstan
-
 Laos
-
 Latvia
-
 Lebanon
-
 Lesotho
-
 Libya
-
 Lithuania
-
 Luxembourg
-
 Madagascar
-
 Malaysia
-
 Malta
-
 Mauritius
-
 Mexico
-
 Moldova
-
 Mongolia
-
 Montenegro
-
 Morocco
-
 Mozambique
-
 Myanmar
-
 Namibia
-
 Nepal
-
 Netherlands
-
 New Zealand
-
 Nigeria
-
 North Macedonia
-
 Norway
-
 Oman
-
 Pakistan
-
 Palestine
-
 Panama
-
 Papua New Guinea
-
 Paraguay
-
 Peru
-
 Philippines
-
 Poland
-
 Portugal
-
 Puerto Rico
-
 Qatar
-
 Reunion
-
 Romania
-
 Rwanda
-
 Saudi Arabia
-
 Serbia
-
 Singapore
-
 Slovakia
-
 Slovenia
-
 Somalia
-
 South Africa
-
 Spain
-
 Sri Lanka
-
 Sweden
-
 Switzerland
-
 Syria
-
 Taiwan
-
 Tajikistan
-
 Tanzania
-
 Thailand
-
 Trinidad and Tobago
-
 Tunisia
-
 Turkey
-
 UAE
-
 Uganda
-
 Ukraine
-
 United Kingdom
-
United States
-
 Uruguay
-
 Uzbekistan
-
 Venezuela
-
 Vietnam
-
 Yemen
-
 Zambia
-
 Zimbabwe
- Forex
- Crypto












