

Floki gains around 10.5% after rebound lifts it above 20- and 50-day averages

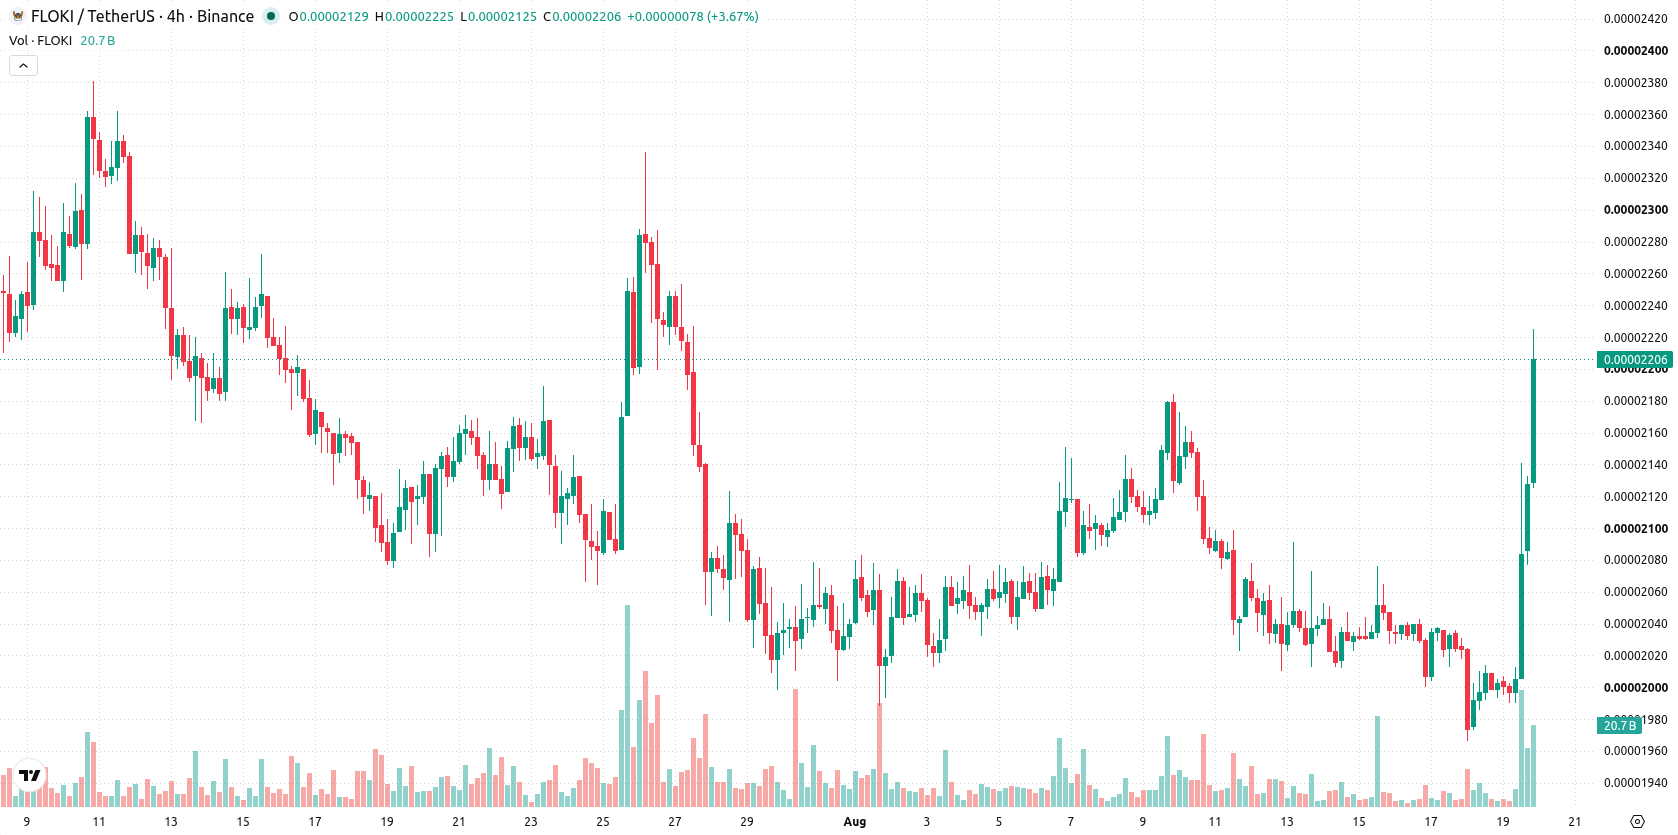
Floki (FLOKI) surged 10.41% in a technical rebound as momentum built above its 20- and 50-day moving averages. The move looks limited, with the price still capped below the long-term 200-day average and resistance near $0.00002272.
 0.000024
0.00002778
0.000024
0.00002778
Highlights
- FLOKI/USD is showing positive short- and medium-term momentum but remains in a long-term downward trend.
- Momentum indicators are weak, with oversold conditions and sellers dominating short-term price action.
- Expected trading range for the next five days is $0.00002099 to $0.00002272, with over 80% probability of a downward move.
Short-term momentum weakens as key resistance holds
FLOKI/USD is trading above its 20-day and 50-day moving averages at $0.00002056 and $0.00002146, but remains below the 200-day moving average at $0.00002737. This alignment suggests positive short- and medium-term momentum, set against a long-term bearish backdrop, with the Ichimoku Kijun at $0.00002151 providing the nearest support and the near-term ceiling at $0.00002272. Momentum indicators point to weak conditions: the Moving Average Convergence Divergence (MACD) and Average Directional Index (ADX) both signal caution, with ADX at low trend strength. The Relative Strength Index (RSI) and Commodity Channel Index (CCI) both signal oversold conditions, while the Stochastic RSI is also in oversold territory. Bull/Bear Power (BBP) is negative, indicating sellers are dominating intraday momentum alongside a "sell" forecast, and the Awesome Oscillator (AO) is neutral. FLOKI/USD gained $0.0000021 or 10.41% with the pair opening nearly flat and now trading near the day's high; intraday volatility stands at 7.00%. The tone remains firm toward session highs, yet the divergence between momentum gain and oversold readings indicates caution is warranted.
Earlier, analysts noted that Floki was experiencing sustained bearish momentum and heightened downside risk. The current rebound adds a new dimension to this outlook, but with long-term resistance still intact, traders should watch for a decisive move above $0.00002272 or a drop below $0.00002151 to signal the next directional shift.









-
 Afghanistan
-
 Albania
-
 Algeria
-
 Angola
-
 Argentina
-
 Armenia
-
 Australia
-
 Austria
-
 Azerbaijan
-
 Bahamas
-
 Bahrain
-
 Bangladesh
-
 Belarus
-
 Belgium
-
 Bolivia
-
 Botswana
-
 Brazil
-
 Brunei
-
 Bulgaria
-
 Cambodia
-
 Cameroon
-
 Canada
-
 Chile
Chile
-
 China
China
-
 Colombia
-
 Congo
Congo
-
 Costa Rica
-
 Cote d'Ivoire
-
 Croatia
-
 Cuba
Cuba
-
 Cyprus
-
 Czechia
-
 DR Congo
-
 Denmark
-
 Dominican Republic
-
 Ecuador
-
 Egypt
Egypt
-
 El Salvador
-
 Estonia
-
 Eswatini
-
 Ethiopia
-
 Finland
-
 France
-
 Georgia
-
 Germany
-
 Ghana
Ghana
-
 Greece
-
 Haiti
Haiti
-
 Hong Kong
-
 Hungary
-
 India
India
-
 Indonesia
-
 Iran, Islamic republic
-
 Iraq
Iraq
-
 Ireland
-
 Israel
-
 Italy
Italy
-
 Jamaica
-
 Japan
Japan
-
 Jordan
-
 Kazakhstan
-
 Kenya
Kenya
-
 Korea
Korea
-
 Kuwait
-
 Kyrgyzstan
-
 Laos
Laos
-
 Latvia
-
 Lebanon
-
 Lesotho
-
 Libya
Libya
-
 Lithuania
-
 Luxembourg
-
 Madagascar
-
 Malaysia
-
 Malta
Malta
-
 Mauritius
-
 Mexico
-
 Moldova
-
 Mongolia
-
 Montenegro
-
 Morocco
-
 Mozambique
-
 Myanmar
-
 Namibia
-
 Nepal
Nepal
-
 Netherlands
-
 New Zealand
-
 Nigeria
-
 North Macedonia
-
 Norway
-
 Oman
Oman
-
 Pakistan
-
 Palestine
-
 Panama
-
 Papua New Guinea
-
 Paraguay
-
 Peru
Peru
-
 Philippines
-
 Poland
-
 Portugal
-
 Puerto Rico
-
 Qatar
Qatar
-
 Reunion
-
 Romania
-
 Rwanda
-
 Saudi Arabia
-
 Serbia
-
 Singapore
-
 Slovakia
-
 Slovenia
-
 Somalia
-
 South Africa
-
 Spain
Spain
-
 Sri Lanka
-
 Sweden
-
 Switzerland
-
 Syria
Syria
-
 Taiwan
-
 Tajikistan
-
 Tanzania
-
 Thailand
-
 Trinidad and Tobago
-
 Tunisia
-
 Turkey
-
 UAE
UAE
-
 Uganda
-
 Ukraine
-
 United Kingdom
-
United States
-
 Uruguay
-
 Uzbekistan
-
 Venezuela
-
 Vietnam
-
 Yemen
Yemen
-
 Zambia
-
 Zimbabwe
- Forex
- Crypto












