

FLOKI climbs nearly 15% after bullish momentum lifts price close to key resistance

Floki (FLOKI) surged 14.73% on strong technical momentum, with buyers driving a broad intraday rally and volatility rising. The move looks limited by overbought oscillator signals and the price structure remaining below the longer-term 200-day moving average.
 0.0000189
0.00002144
Highlights
- FLOKI/USD is trading above short- and medium-term averages but remains below its 200-day trend, with bearish alignment in the long term.
- Buying momentum dominates with FLOKI/USD near its intraday high, but overbought readings from multiple oscillators indicate risk of short-term pullback.
- The expected five-day range is $0.00002401 to $0.00002799, with 58% probability of a move higher and key resistance at $0.0000262.
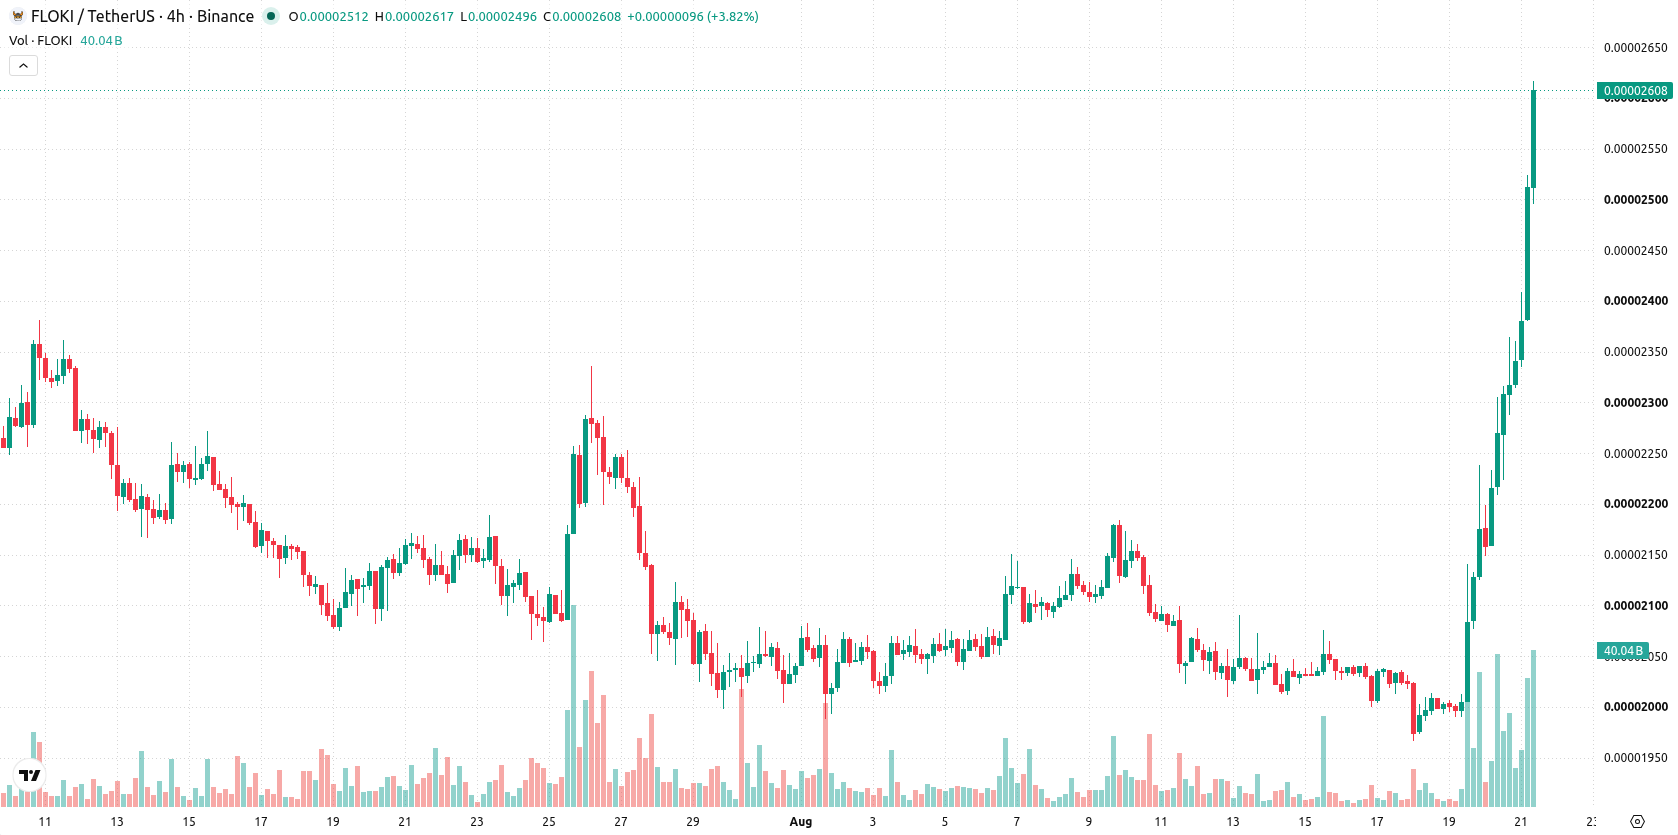
Mixed momentum signals as price tests short-term highs below key moving average
FLOKI/USD is trading above its 20-day and 50-day moving averages ($0.00002077 and $0.0000215), but remains just below the 200-day level ($0.00002725). This setup points to strong short- and medium-term momentum, with longer-term trend alignment still bearish. The nearest resistance stands at $0.0000262 and support at $0.00002401. Momentum readings are mixed: the Moving Average Convergence Divergence (MACD) and Average Directional Index (ADX) are neutral. The Relative Strength Index (RSI) is near 69 and flashing "Buy", but both the Stochastic RSI and Commodity Channel Index (CCI) indicate overbought territory. Bull/Bear Power (BBP) is positive, confirming buyers dominate intraday momentum, and this is reinforced by an overbought call from oscillators. Daily performance is strong, with FLOKI/USD up 0.0000033 (14.73%) on an upside gap of roughly 3.08%. The price is near its intraday high and volatility is elevated at 12.45%. Momentum signals point to strength toward session highs, but some oscillators warn of possible short-term exhaustion.
Earlier, analysts noted that FLOKI's price action was buoyed by strong short- and medium-term momentum, but longer-term resistance and overbought signals posed correction risks. The current analysis adds dimension by highlighting elevated volatility and a balanced probability for up or down moves, suggesting traders should closely monitor the $0.0000262 resistance for any sustained breakout.










-
 Afghanistan
-
 Albania
-
 Algeria
-
 Angola
-
 Argentina
-
 Armenia
-
 Australia
-
 Austria
-
 Azerbaijan
-
 Bahamas
-
 Bahrain
-
 Bangladesh
-
 Belarus
-
 Belgium
-
 Bolivia
-
 Botswana
-
 Brazil
-
 Brunei
-
 Bulgaria
-
 Cambodia
-
 Cameroon
-
 Canada
-
 Chile
-
 China
-
 Colombia
-
 Congo
-
 Costa Rica
-
 Cote d'Ivoire
-
 Croatia
-
 Cuba
-
 Cyprus
-
 Czechia
-
 DR Congo
-
 Denmark
-
 Dominican Republic
-
 Ecuador
-
 Egypt
-
 El Salvador
-
 Estonia
-
 Eswatini
-
 Ethiopia
-
 Finland
-
 France
-
 Georgia
-
 Germany
-
 Ghana
-
 Greece
-
 Haiti
-
 Hong Kong
-
 Hungary
-
 India
-
 Indonesia
-
 Iran, Islamic republic
-
 Iraq
-
 Ireland
-
 Israel
-
 Italy
-
 Jamaica
-
 Japan
-
 Jordan
-
 Kazakhstan
-
 Kenya
-
 Korea
-
 Kuwait
-
 Kyrgyzstan
-
 Laos
-
 Latvia
-
 Lebanon
-
 Lesotho
-
 Libya
-
 Lithuania
-
 Luxembourg
-
 Madagascar
-
 Malaysia
-
 Malta
-
 Mauritius
-
 Mexico
-
 Moldova
-
 Mongolia
-
 Montenegro
-
 Morocco
-
 Mozambique
-
 Myanmar
-
 Namibia
-
 Nepal
-
 Netherlands
-
 New Zealand
-
 Nigeria
-
 North Macedonia
-
 Norway
-
 Oman
-
 Pakistan
-
 Palestine
-
 Panama
-
 Papua New Guinea
-
 Paraguay
-
 Peru
-
 Philippines
-
 Poland
-
 Portugal
-
 Puerto Rico
-
 Qatar
-
 Reunion
-
 Romania
-
 Rwanda
-
 Saudi Arabia
-
 Serbia
-
 Singapore
-
 Slovakia
-
 Slovenia
-
 Somalia
-
 South Africa
-
 Spain
-
 Sri Lanka
-
 Sweden
-
 Switzerland
-
 Syria
-
 Taiwan
-
 Tajikistan
-
 Tanzania
-
 Thailand
-
 Trinidad and Tobago
-
 Tunisia
-
 Turkey
-
 UAE
-
 Uganda
-
 Ukraine
-
 United Kingdom
-
United States
-
 Uruguay
-
 Uzbekistan
-
 Venezuela
-
 Vietnam
-
 Yemen
-
 Zambia
-
 Zimbabwe
- Forex
- Crypto












